Locate the decision
Mark meaningful swing points and potential liquidity before price gets there. This reduces hindsight: the important level is recorded before a reaction appears.
Independent illustrated field guide · 1H examples
Learn price action in a logical order: swing highs and lows, liquidity, structural change, displacement and possible reaction zones. Each illustrated lesson distinguishes observation from interpretation.
Start with market structureBrowse concepts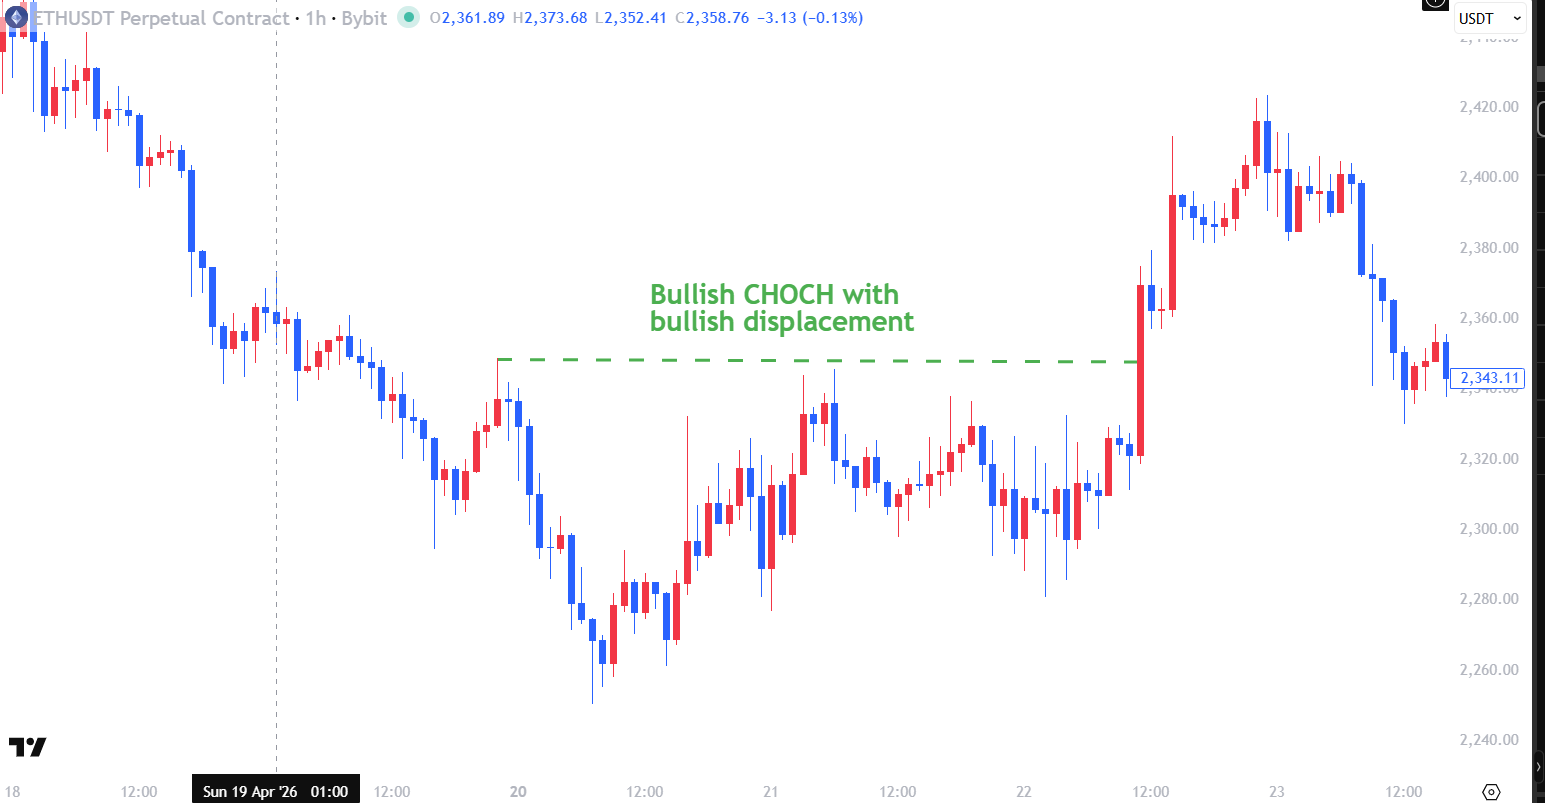
01 / Purpose
ICT, short for Inner Circle Trader, is a vocabulary and framework for examining where price is relative to obvious highs, lows and imbalances. Its usefulness is in forming testable chart questions, not in guaranteeing what happens next.
Mark meaningful swing points and potential liquidity before price gets there. This reduces hindsight: the important level is recorded before a reaction appears.
Instead of treating an FVG or order block as a signal on its own, ask what preceded it: a sweep, a structural break and directional displacement?
A written scenario includes a confirming observation, an invalidation level and a reason to stand aside. Reviewing failed cases matters as much as studying successful ones.
02 / Foundation
Market structure describes the sequence of meaningful swing highs and swing lows. Establish this sequence before naming a sweep, BOS or MSS.
A swing high is a local peak flanked by lower prices; a swing low is a local trough flanked by higher prices. Which peaks count depends on the timeframe and swing size. On a one-hour chart, decide your swing rule in advance and keep it consistent. A pivot often becomes clear only after later candles print.
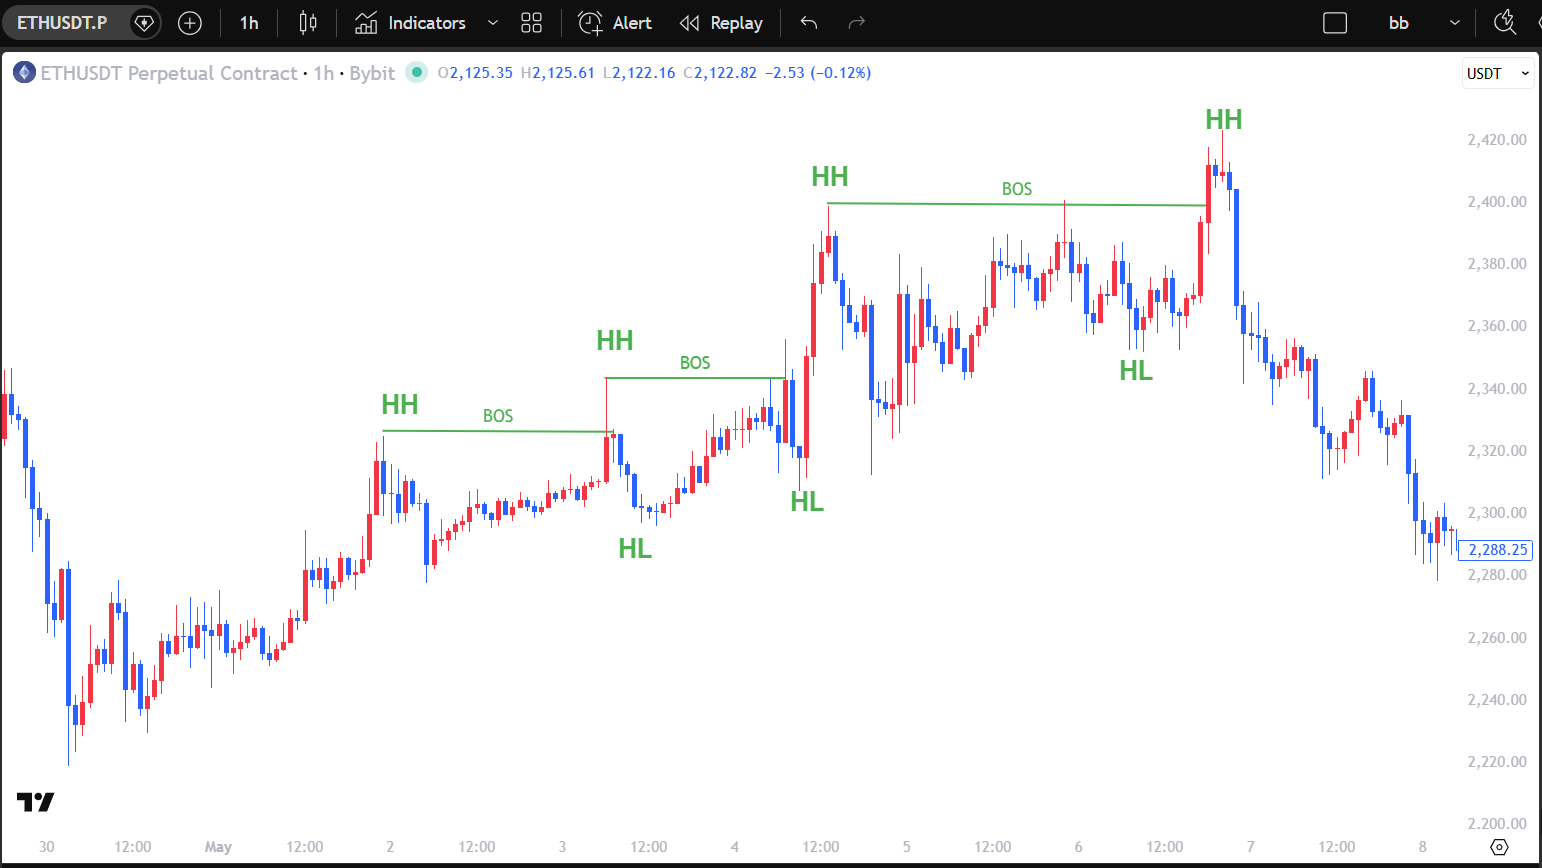
Each meaningful peak exceeds the prior peak, and pullbacks hold above the prior meaningful low. A new high by itself is less informative if the next pullback destroys the sequence.
Original screenshot · Charts by TradingView
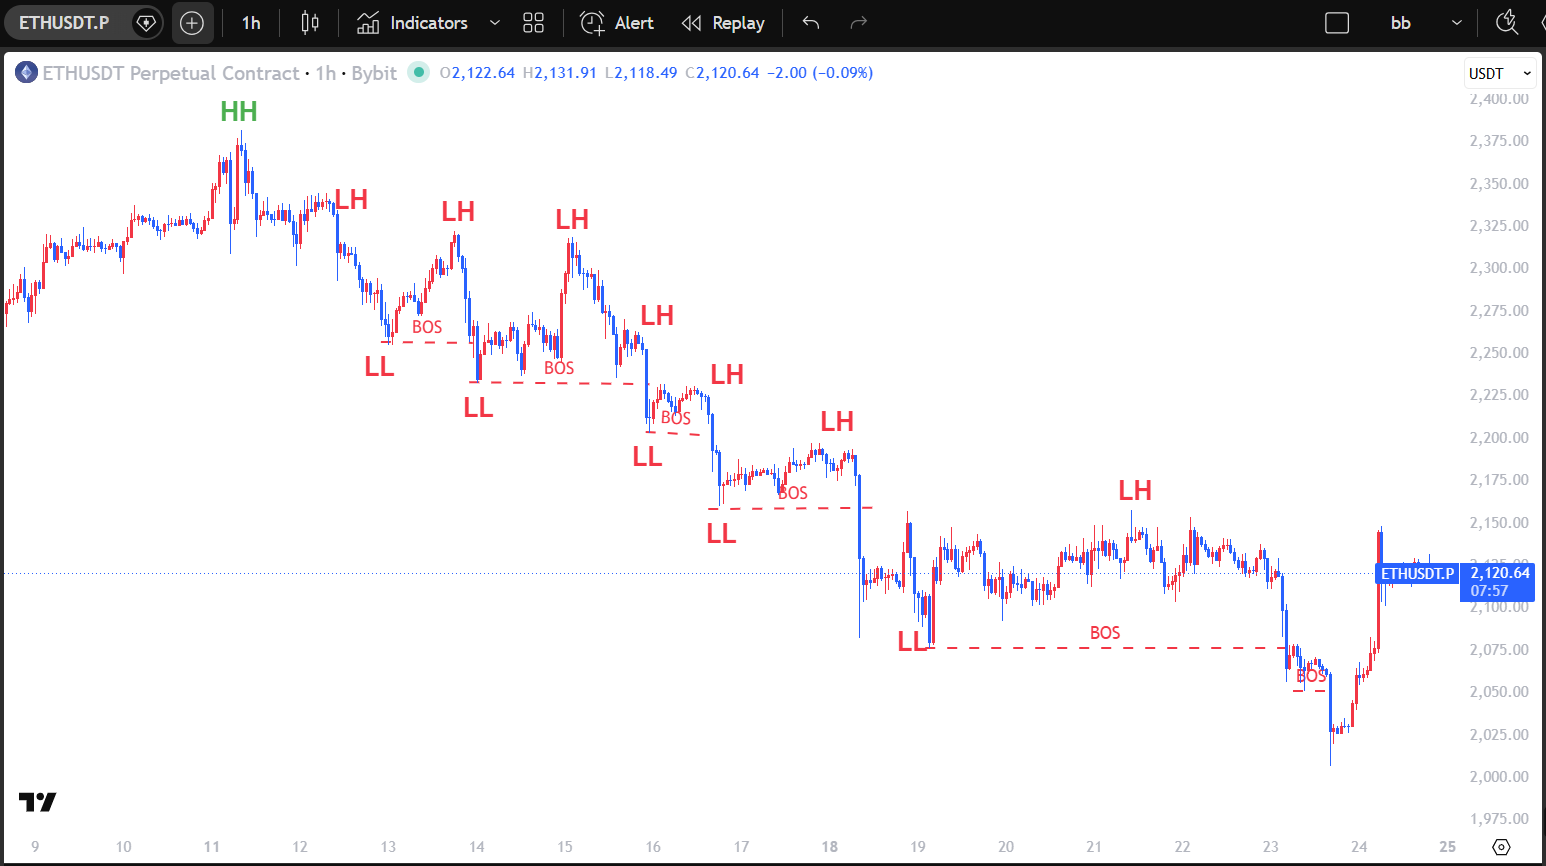
Each meaningful trough falls below the previous trough, while rallies fail below the prior high. A single upward candle can still be a pullback inside this structure.
Original screenshot · Charts by TradingView
| HH | Higher high | A swing high above the previous relevant swing high. |
|---|---|---|
| HL | Higher low | A swing low above the previous relevant swing low. |
| LH | Lower high | A swing high below the previous relevant swing high. |
| LL | Lower low | A swing low below the previous relevant swing low. |
External swings frame the larger one-hour move; smaller swings inside it are internal structure. An internal bearish break can be a pullback within an external uptrend. State which scale your label describes before claiming a trend change.
Repeated, overlapping highs and lows suggest a range rather than clean HH/HL or LH/LL progression. Mark its edges, reduce directional confidence and wait for meaningful acceptance outside the range or a clearer sequence.
The labels describe the earlier segment; the later candles show that structures can fail.
03 / Concept library
Annotated chart examples are provided below. Some excerpts are cropped, so they cannot establish the entire prior market structure.
Mark the obvious highs and lows before looking for a reaction.
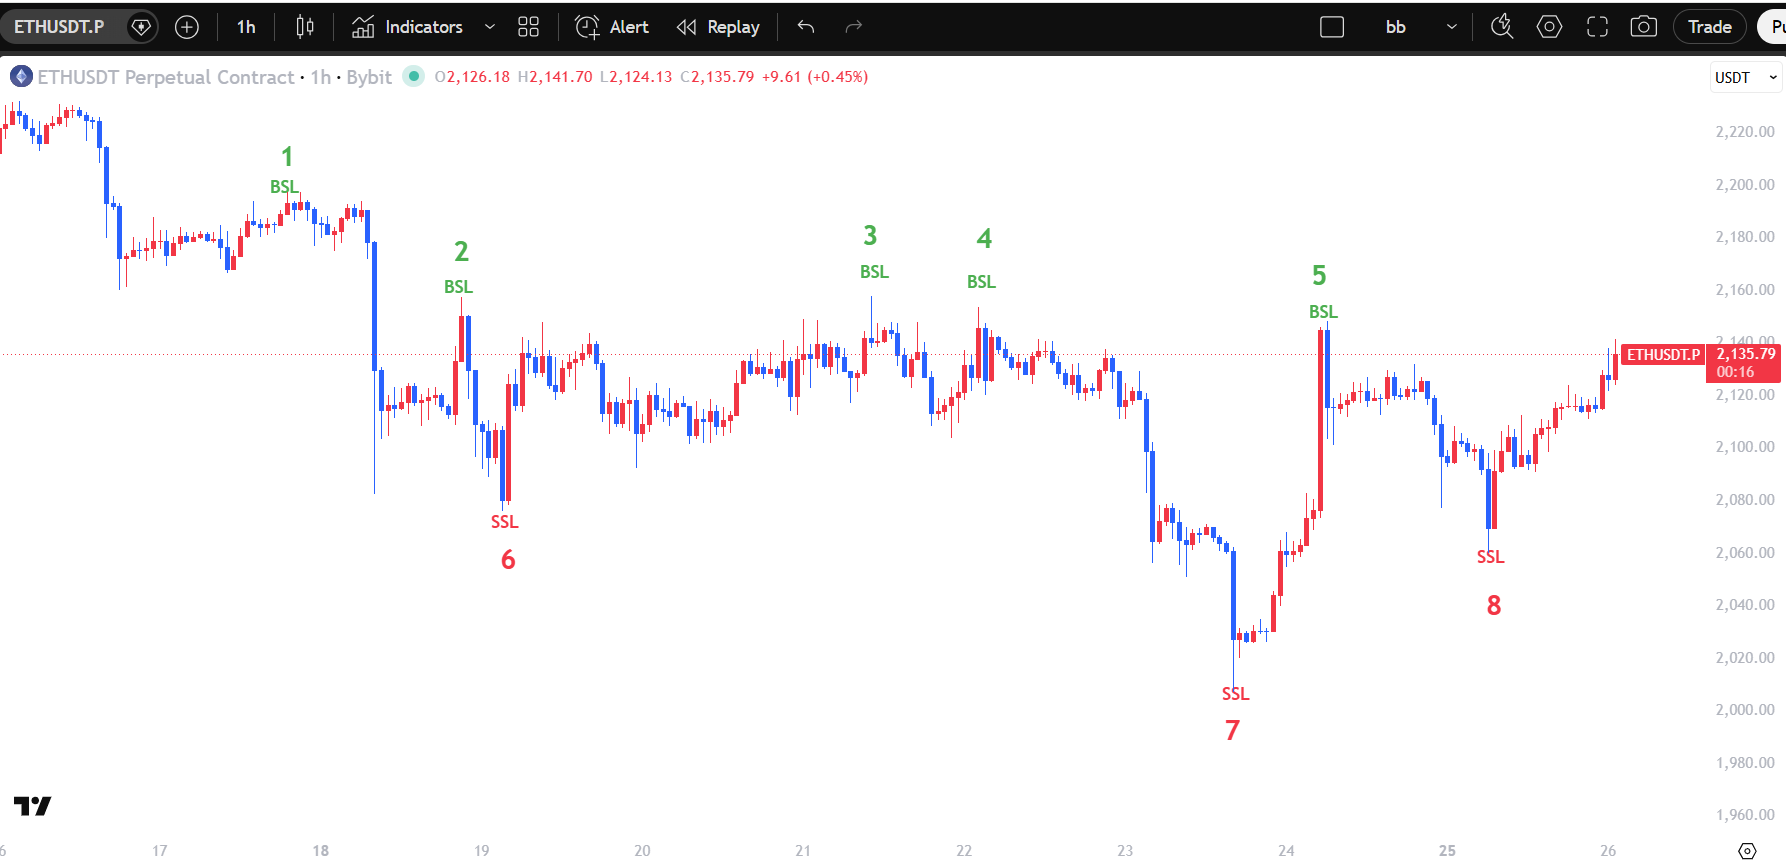 Original screenshot · Charts by TradingView
Buy-side liquidity (BSL) is a working label for orders that may cluster above visible highs; sell-side liquidity (SSL) refers to the area below visible lows. Equal or near-equal highs and lows often make these zones easy to see. A drawn level represents a potential order location, not a verified record of anyone’s actual positions.
If price approaches two prior highs at nearly the same level, label the area above them BSL. A move through it might reverse, pause, or continue; wait to see which occurs.
The presence of liquidity does not require price to visit it. Thin markets can overshoot levels, and a clean breakout is not automatically a stop hunt.
A move past a level is only the beginning of the observation.
Original screenshot · Charts by TradingViewA sweep is an excursion through a pre-marked high or low followed by a return into the prior range. For a bullish interpretation, price may trade below SSL and then close back above the old low. The competing interpretation is continuation: price accepts below that low and keeps falling.
A prior level is only a sweep candidate when price moves through it and returns. The supplied liquidity chart marks BSL and SSL, but does not alone prove a confirmed sweep; compare closes and following structure on the full chart.
A long wick by itself does not prove that large traders deliberately moved price. Avoid treating every pierced level as a reversal signal.
Distinguish trend continuation from the first credible shift.
Original screenshot · Charts by TradingViewA break of structure (BOS) usually describes a break in the existing trend direction. A change of character (CHOCH) describes an early break against the previous sequence. Market structure shift (MSS) is often used for a more forceful counter-trend break, particularly after a liquidity event. Traders use these labels differently, so the chosen swing and confirmation rule matter more than the acronym.
The HH/HL screenshot shows successive highs, lows and BOS labels before a later decline. The comparison screenshot marks both bullish and bearish CHOCH; these are local changes that require a stated swing scale.
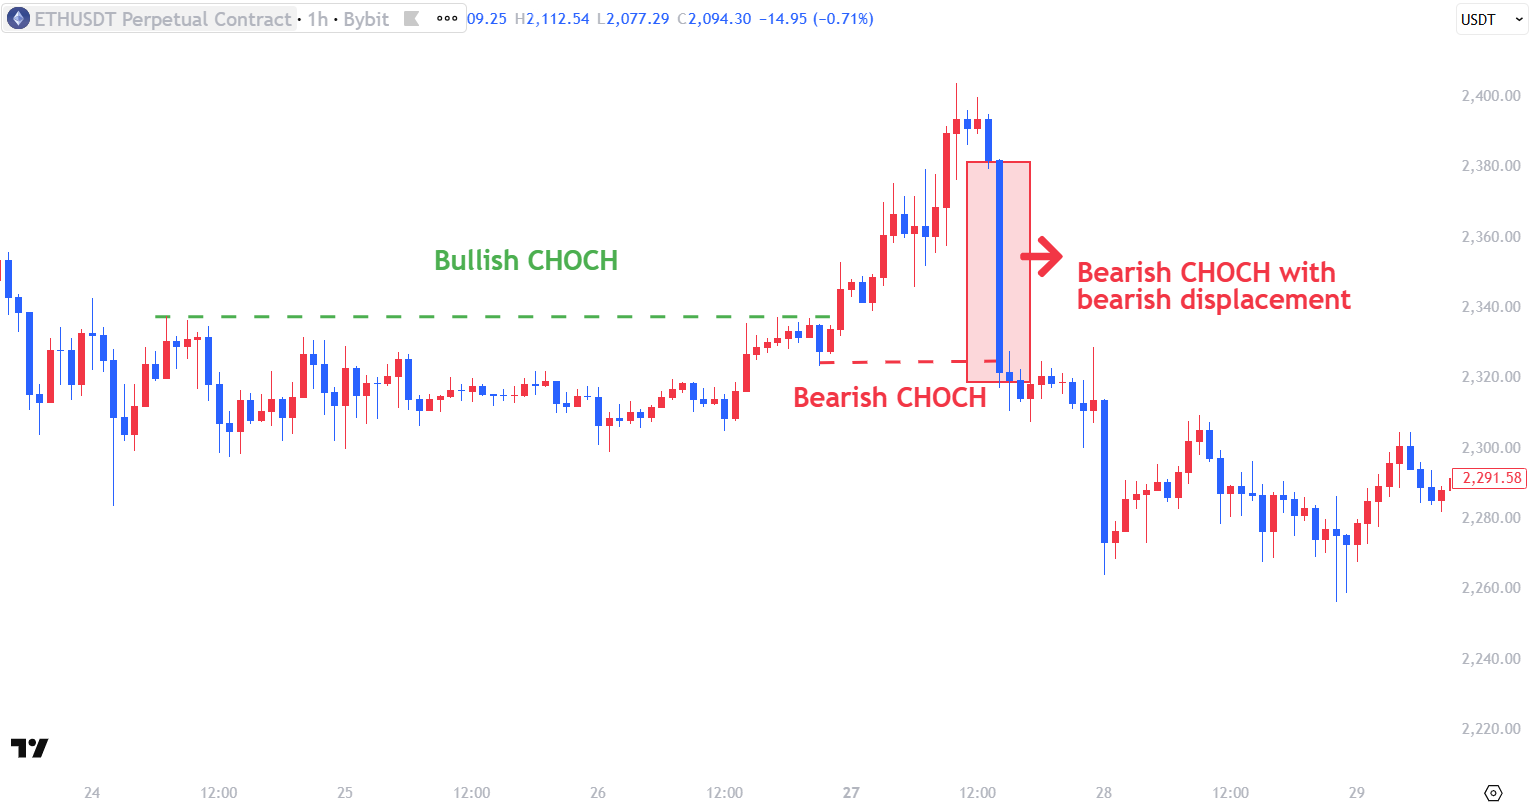
A minor internal break can be an ordinary pullback. Calling it a complete reversal without a higher-timeframe check can misstate the evidence.
Judge the strength of the break by the body, close and follow-through.
Original screenshot · Charts by TradingViewDisplacement is an unusually decisive directional move relative to nearby candles. It often has a substantial body, a close beyond a meaningful swing and limited immediate overlap. Some moves leave a fair value gap, but a gap is not required to recognize strong movement.
The bullish CHOCH screenshot marks a strong upward candle through a local level. The comparison shows a large bearish candle and subsequent downside movement. Compare body, close and follow-through without assuming either move predicts the next one.
A large candle can be a late, risky entry, especially when the invalidation point is far away. News and low liquidity can also produce unusually large bars.
Define the three-candle interval exactly; then evaluate its context.
 Original screenshot · Charts by TradingView
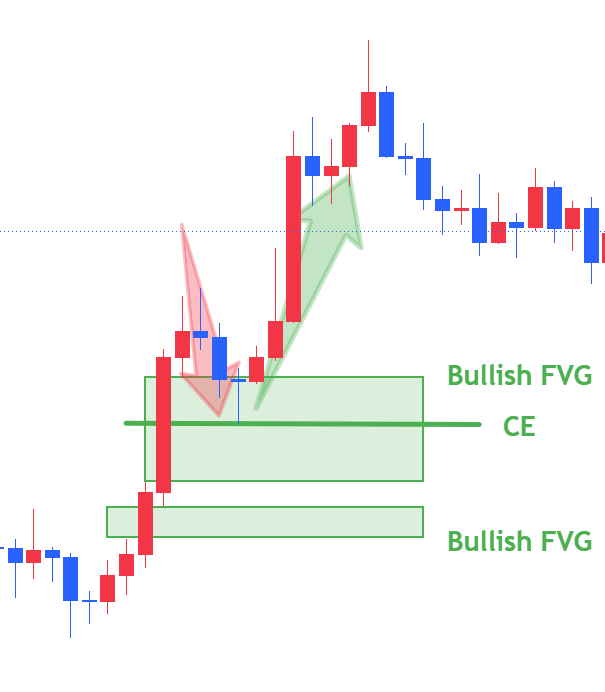
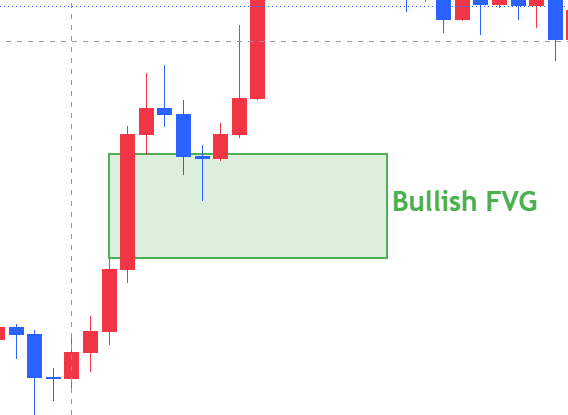
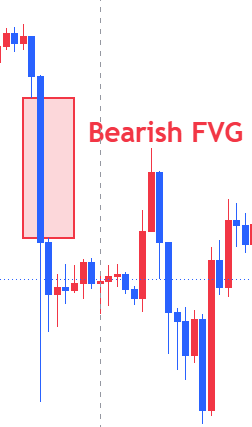
A bullish FVG exists when candle 1’s high is below candle 3’s low in a three-candle sequence. The interval between those prices is the gap. A bearish FVG is the inverse: candle 1’s low is above candle 3’s high. The middle candle is usually the displacement leg. This is a visual price imbalance, not an exchange guarantee that the area must be revisited.
In the bullish diagram, the first high and third low bound the highlighted gap. The second diagram reverses the geometry for a bearish move.
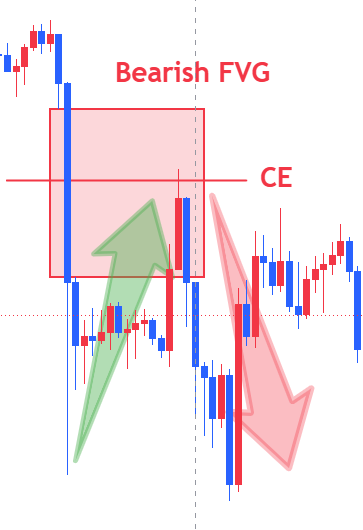
A gap can remain open indefinitely, be filled without a reaction, or fail on the first return. Tiny gaps inside a choppy range are easy to overinterpret.
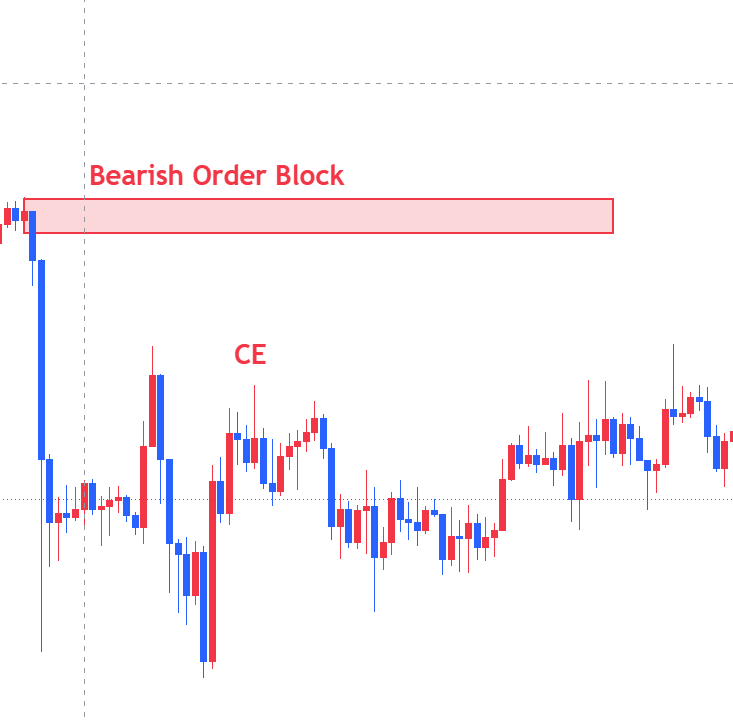
Use the preceding candle as a candidate zone, not proof of hidden orders.
 Original screenshot · Charts by TradingView
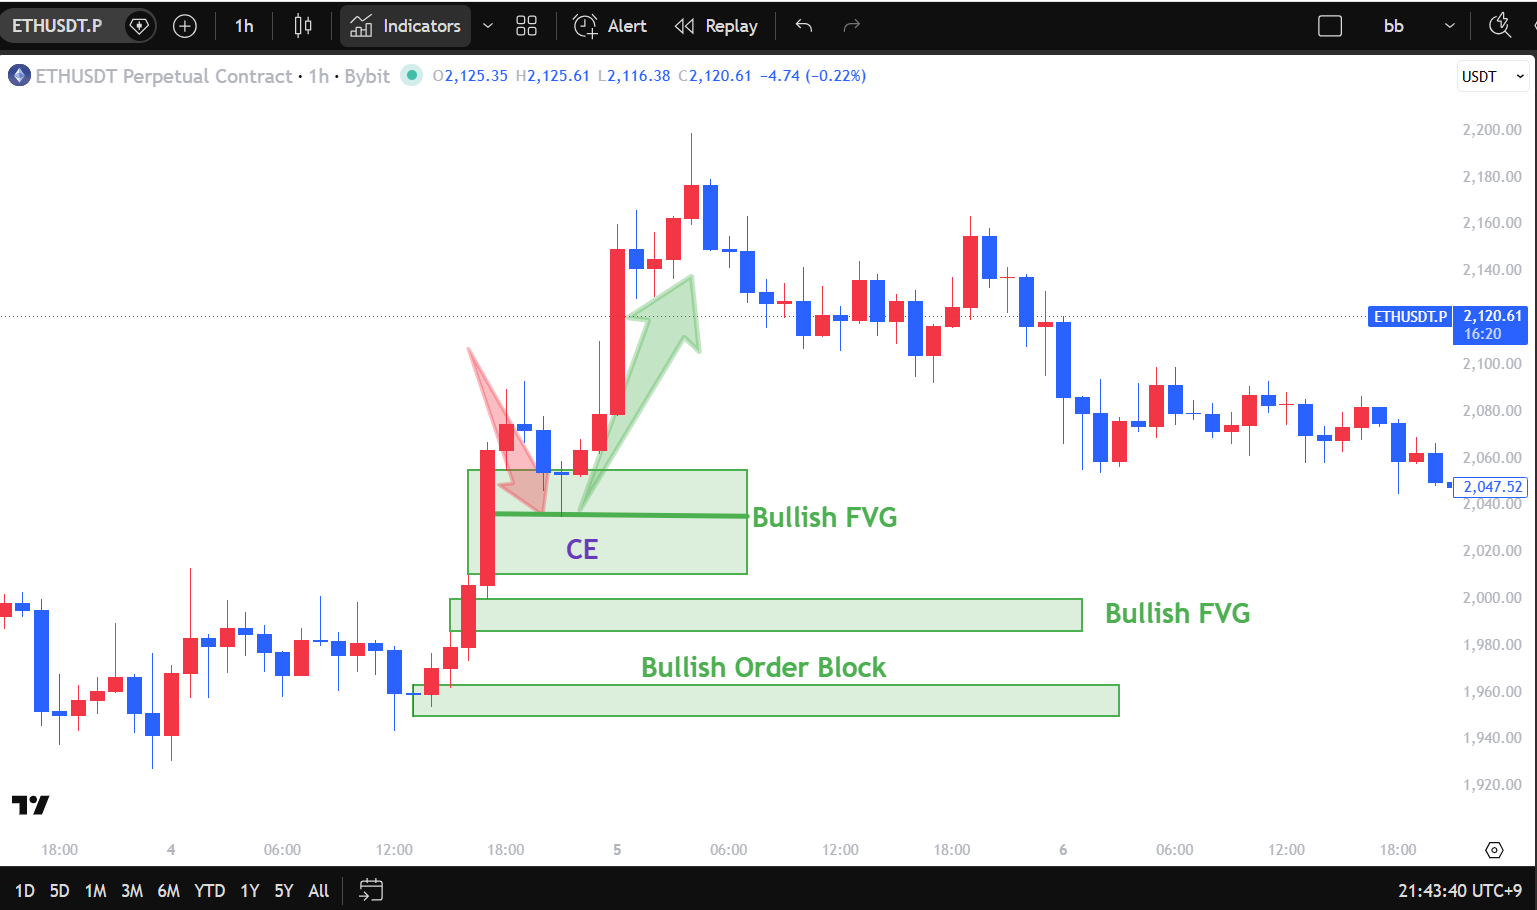
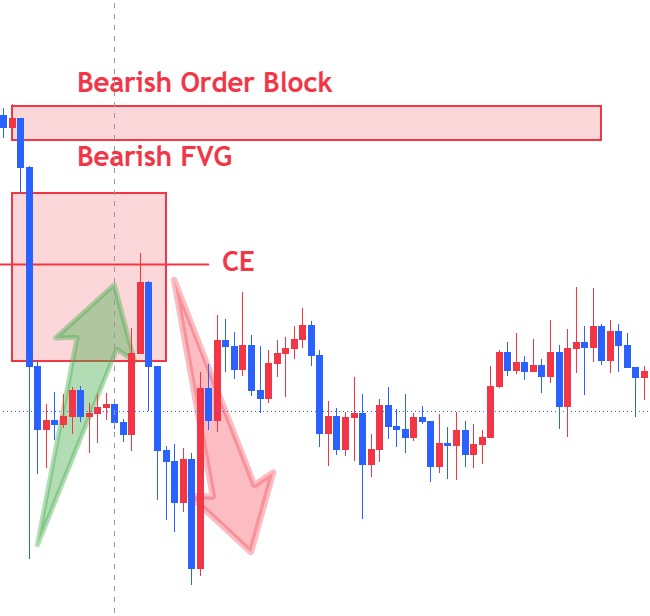
A common bullish OB convention marks the last down candle before a strong upward move that shifts structure; bearish OB uses the last up candle before a strong downward move. Traders vary between the candle body and its full high–low range. Make that choice explicit and apply it consistently. The label does not reveal actual institutional orders.
The bullish chart highlights the last down candle before an upward displacement. The bearish chart shows the mirror image and a later revisit.
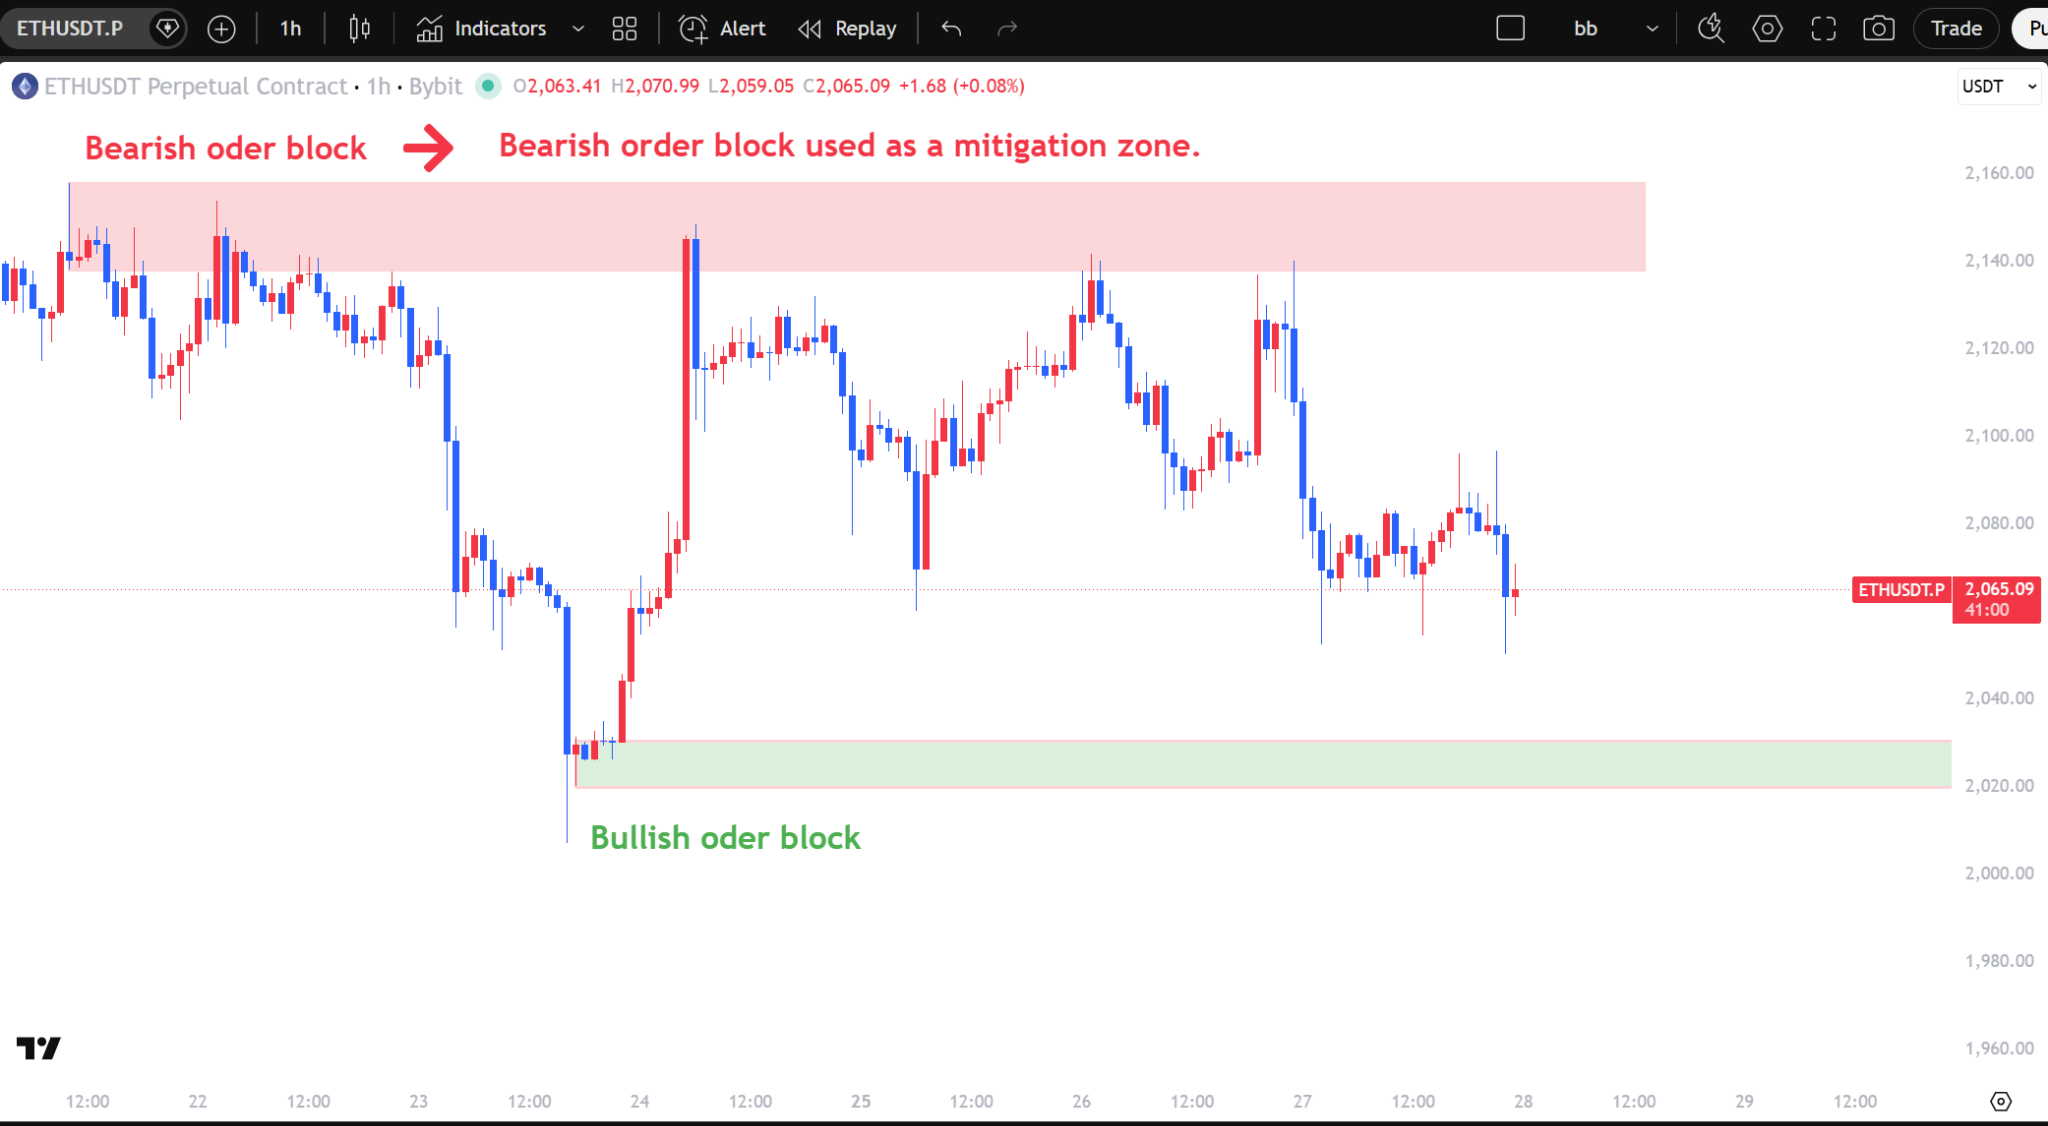
Not every opposite-color candle is an OB. A zone that fails to provoke a reaction should not be repeatedly moved to fit the next candle.
ETHUSDT / 1H
Fourteen annotated screenshots supplied by the site owner. These show what was marked on the chart; the labels are interpretations, not independently verified exchange order flow. Open an image to examine it at its original resolution.
Compare the labeled swing sequence with what happens later. The final bars can invalidate an earlier uptrend or downtrend.
BSL and SSL mark candidate areas around visible highs and lows, not confirmed resting orders.
The cropped views emphasize the proposed gap and midpoint. Check the complete three-candle geometry when the full chart is available.
A highlighted candle is an OB candidate. A later revisit does not by itself prove institutional participation or a valid trade.
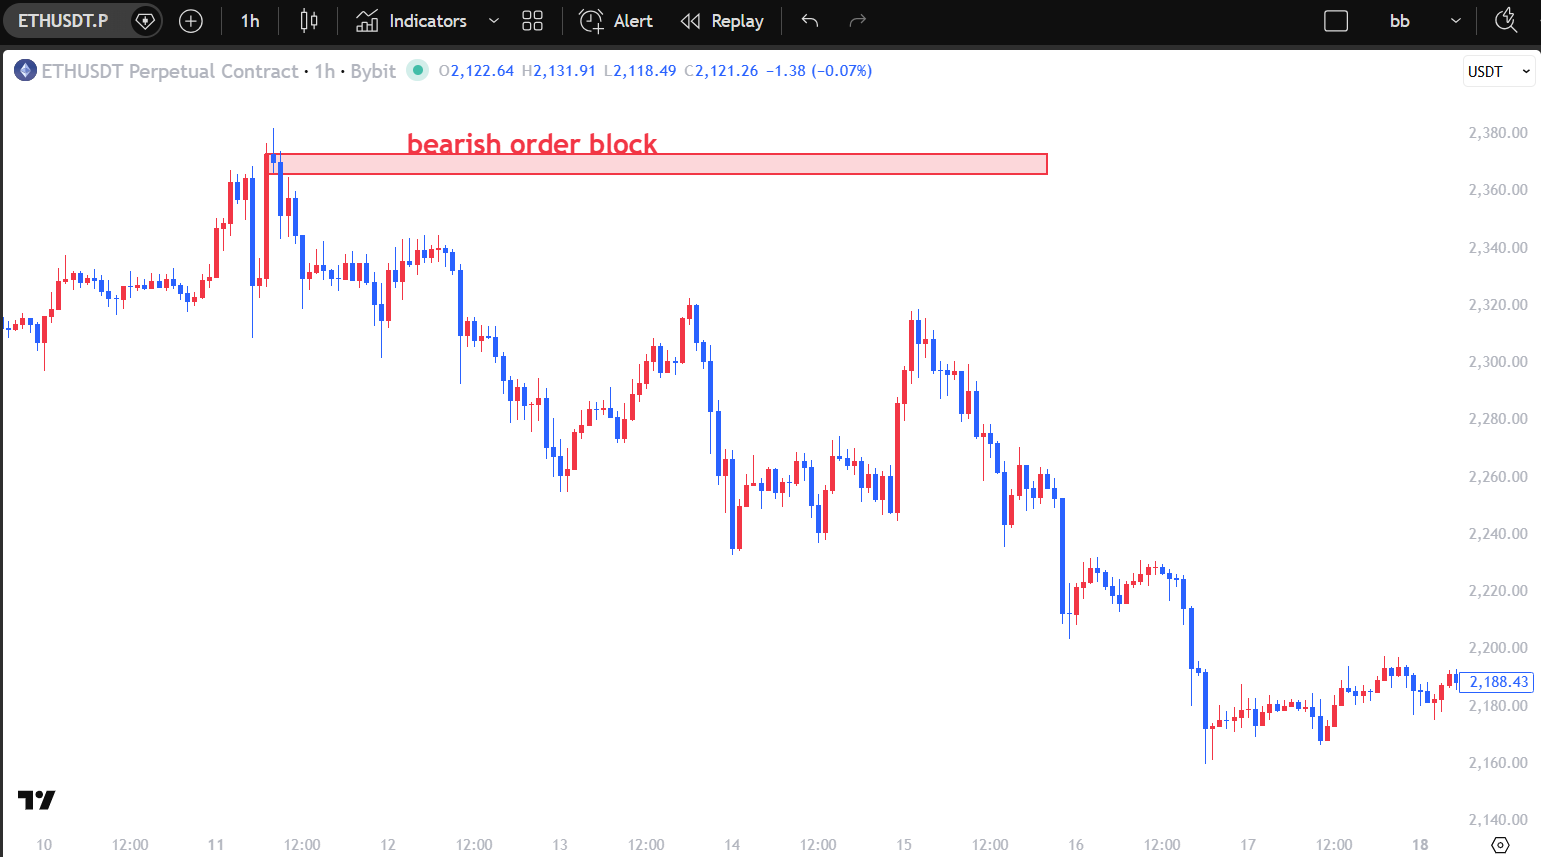
Full screenshots show ETHUSDT perpetual, 1h, Bybit. Cropped excerpts may omit the instrument or date; do not infer either from a crop.
Deep study
Four deeper questions turn a chart label into a repeatable analysis. These are decision filters, not extra signals.
A pivot high is only known after later candles fail to exceed it; a pivot low needs later candles that hold above it. On a one-hour chart, choose one consistent swing scale and write down whether a candle must close through the level to count as a break. Mark external swings separately from smaller internal swings.
If a new high forms but the next pullback takes out the prior higher low, redraw the sequence from the new evidence. Never move the original level to preserve a preferred narrative.
Question: would the same swing rule identify this level in a losing example?
Take a defined swing high and swing low to form a dealing range. Its midpoint splits the range into a premium half and a discount half; this is relative position, not a valuation of what an asset is “worth.” A bullish idea near the lower half may offer more room toward opposing liquidity, but structure and risk still decide whether it is usable.
When a new external swing is confirmed, the range may need to be redefined. Avoid selecting endpoints after the reversal because this creates a perfect-looking midpoint in hindsight.
Question: which two confirmed swings defined this range before the setup?
A higher timeframe such as four hours can show the broad range, external swings and a larger liquidity target. The one-hour chart can then show the local sweep, shift and return. A one-hour bullish MSS inside a four-hour downtrend is still a countertrend idea until larger structure changes. Neither timeframe cancels the other.
The site does not require a particular trading session: the same analytical sequence can be studied around the clock. Thin liquidity and event volatility still change the reliability of a single candle.
Question: is this a higher-timeframe continuation or a local countertrend reversal?
Before revealing later candles in replay, record the timestamp, instrument, market regime, swing levels, chosen definition of a sweep, confirming close, potential invalidation and next liquidity target. Then record what actually happened and whether you followed your own rules.
Count both triggered and skipped examples. A few attractive screenshots do not establish a win rate or expectancy; costs, spreads and adverse moves belong in any serious test. Revise one rule at a time so you can understand what changed.
Question: what observation would have made you abandon the setup?
04 / Applied reading
This is a study sequence, not an automatic entry system. Reverse the highs, lows and directional moves to evaluate a bearish case.
Identify external trend or range, then mark internal swings and the next visible BSL and SSL pools.
Does price sweep a marked pool and return, or does it close beyond and continue? Do not decide from a wick alone.
Check a relevant opposite-side swing break, a decisive close and displacement. Define which structure scale shifted.
Only then study an FVG or OB, the invalidation point and the distance to the next liquidity target.
The examples are educational. Crypto and leveraged derivatives can incur substantial losses; a pattern is never a substitute for position sizing, market-specific risk assessment or independent testing.
07 / INDICATORS
Explore the owner's chart tools alongside the ICT lessons. Each screenshot shows an example display, not a verified result. Open a chart to inspect the original image.
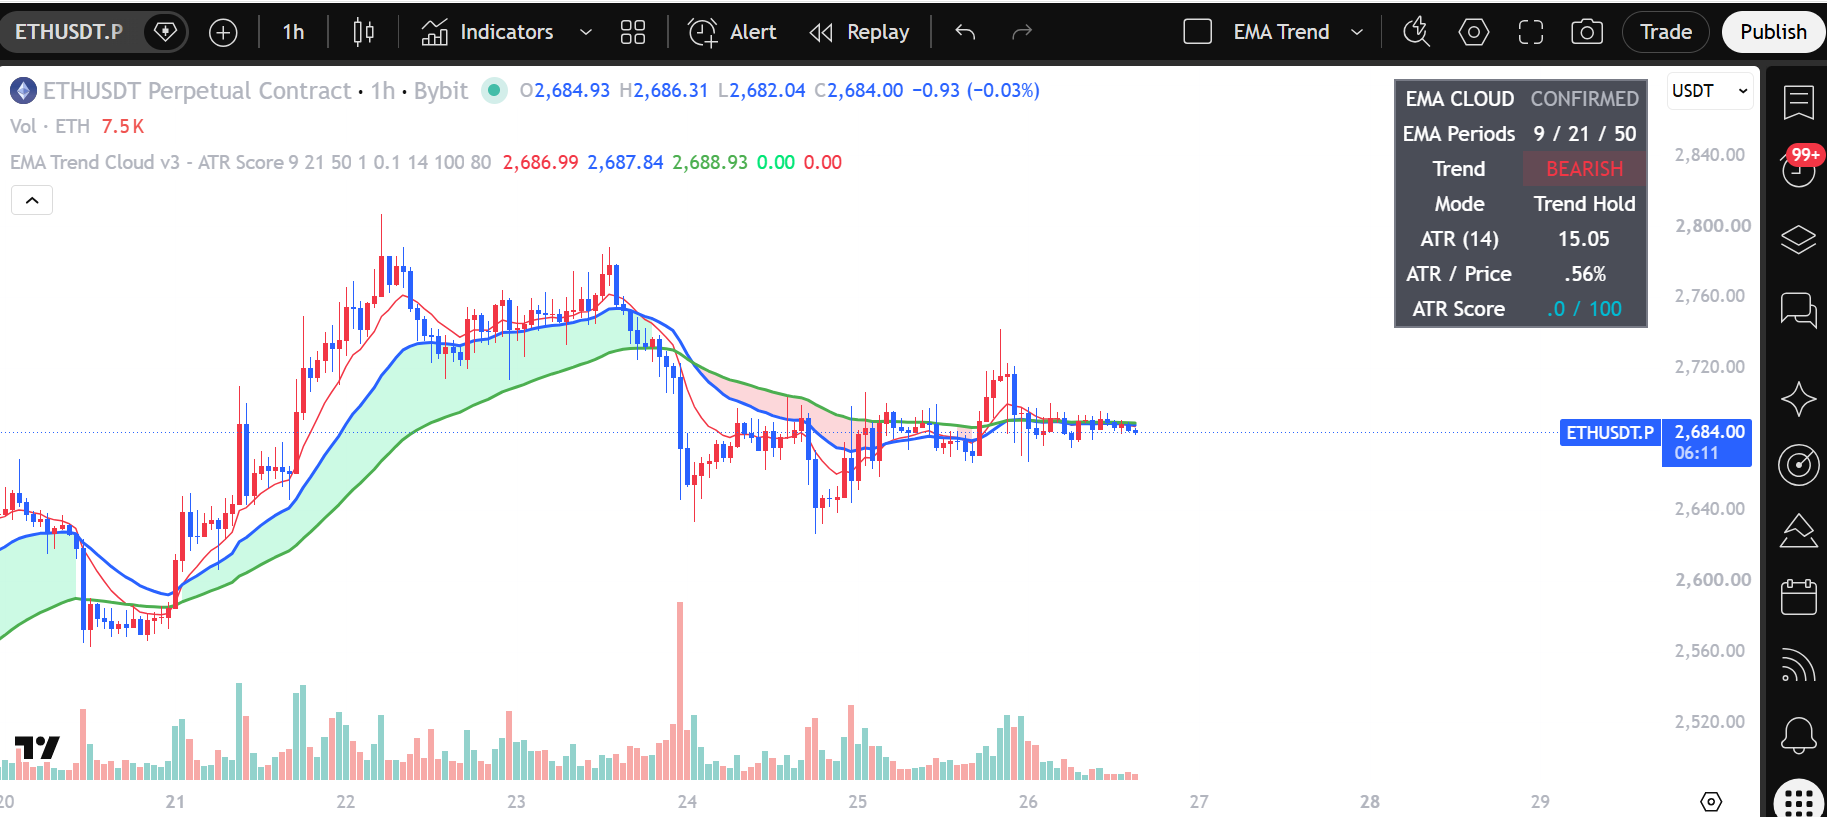
01 / Trend context
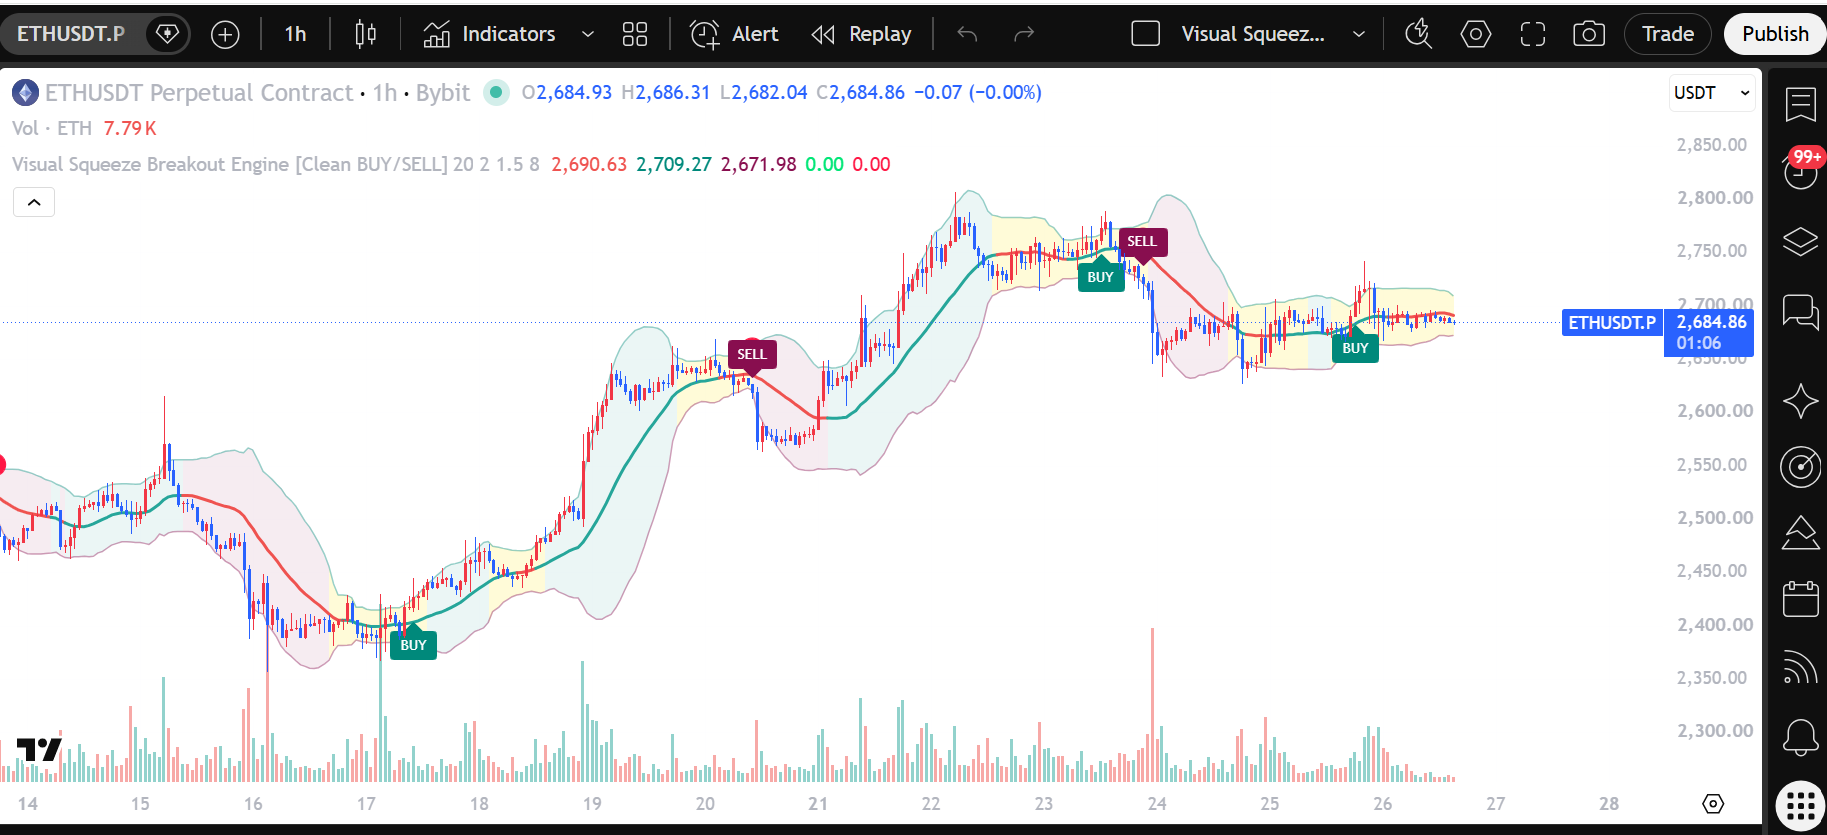
02 / Breakout signals
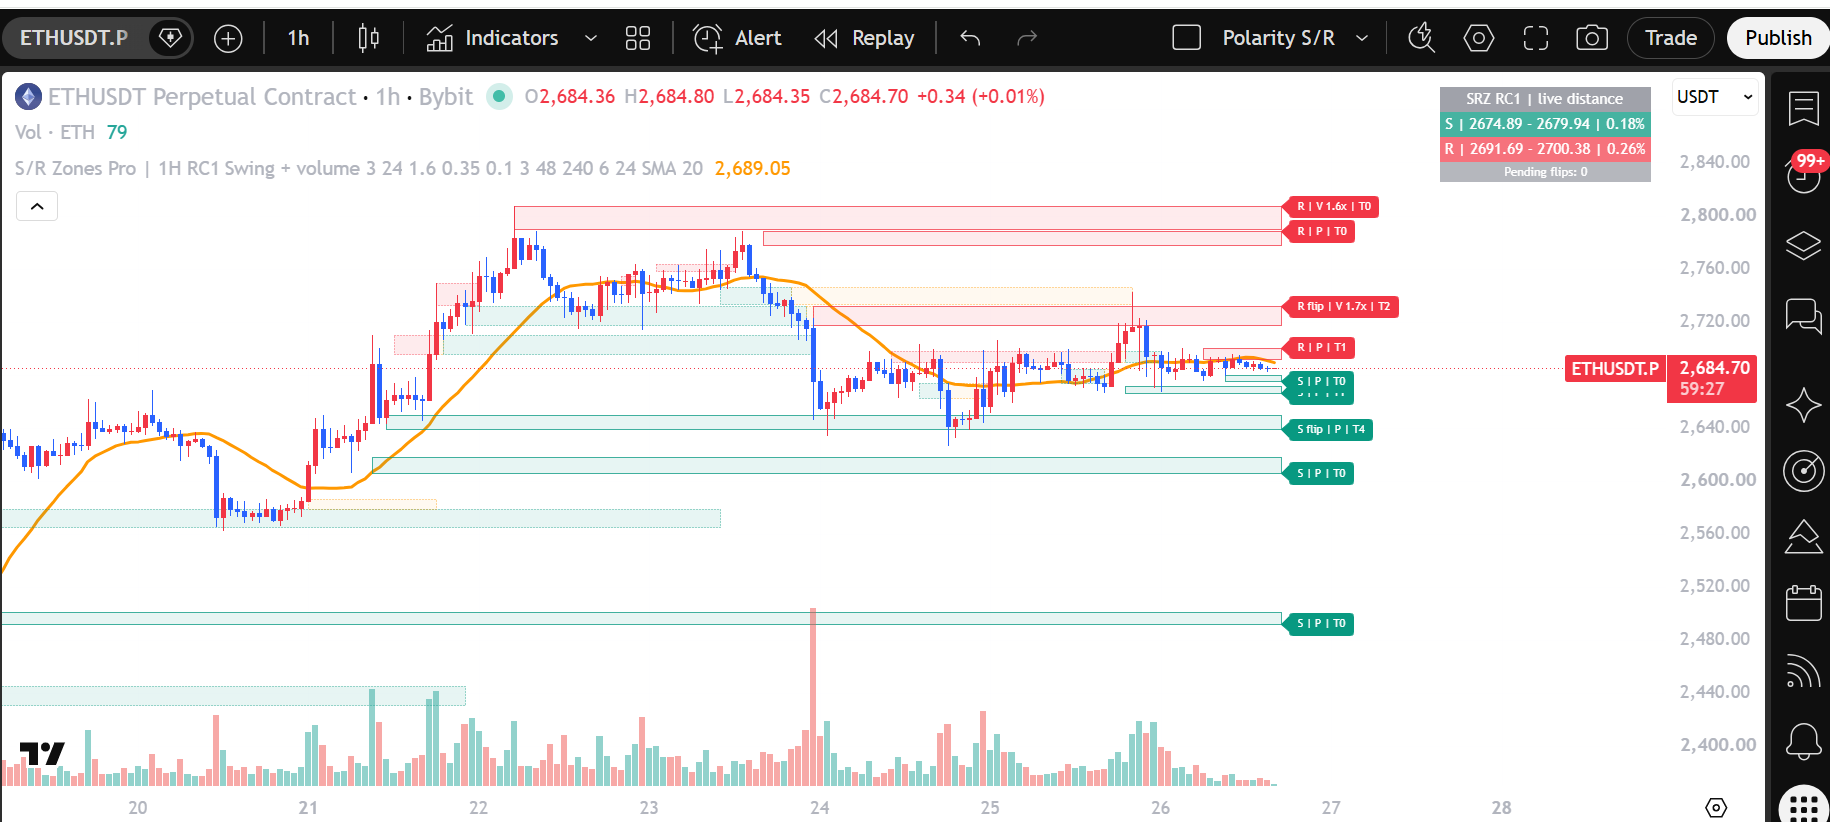
03 / Support and resistance
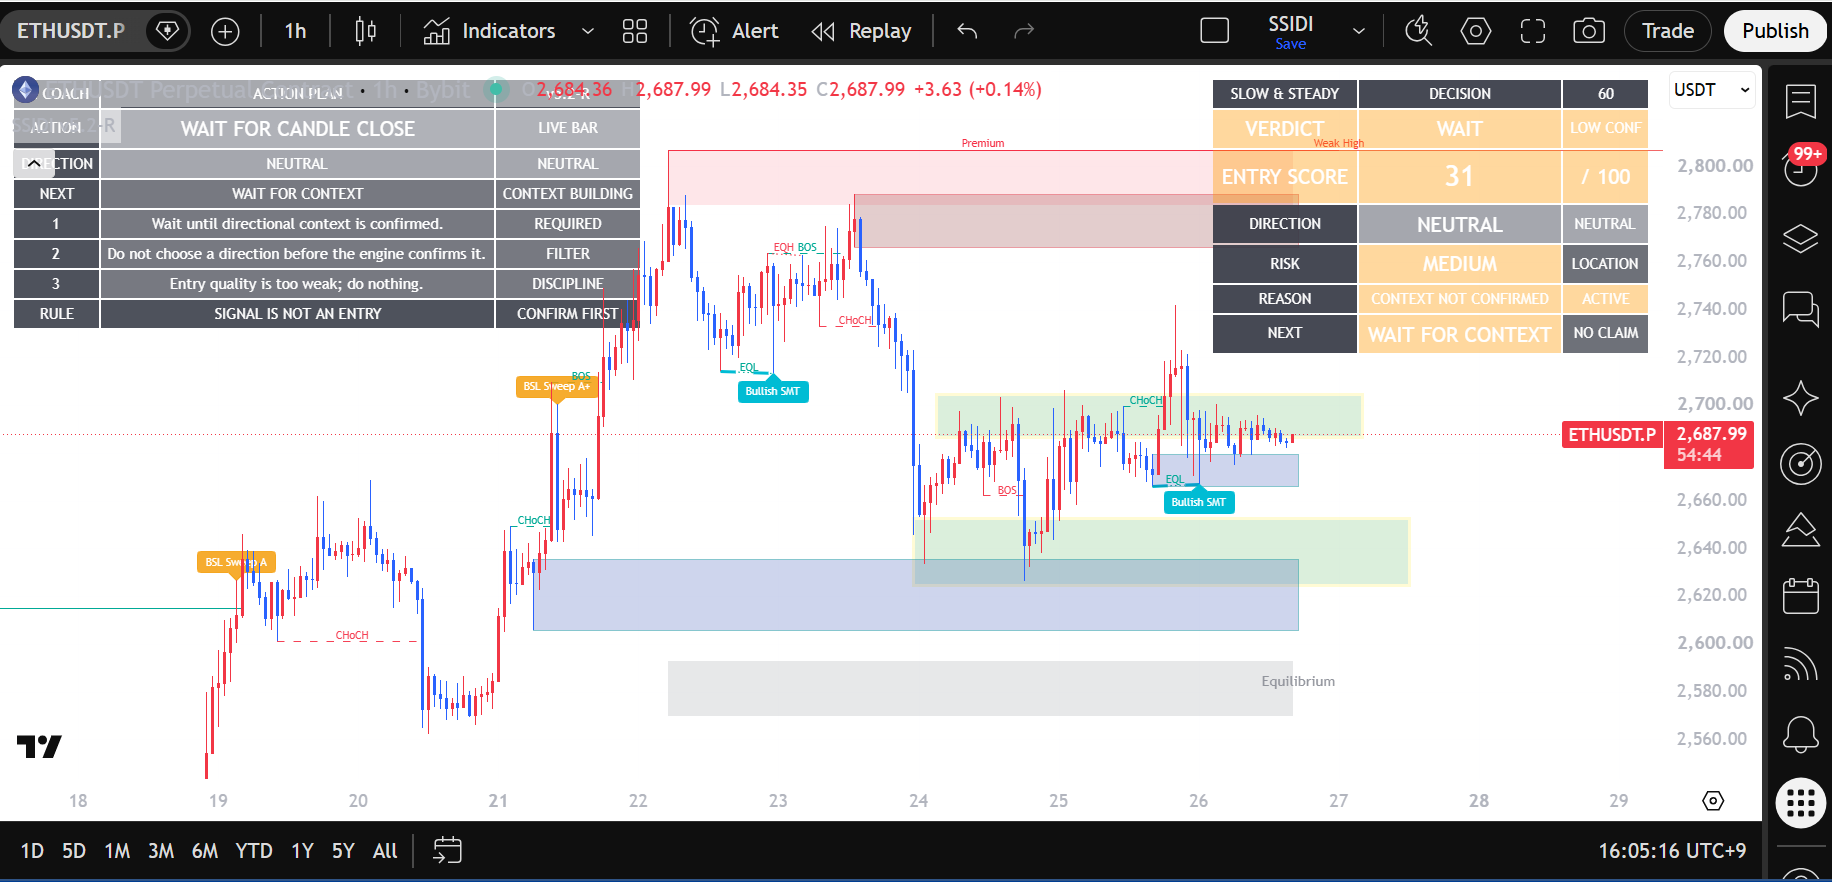
04 / Market flow and entries
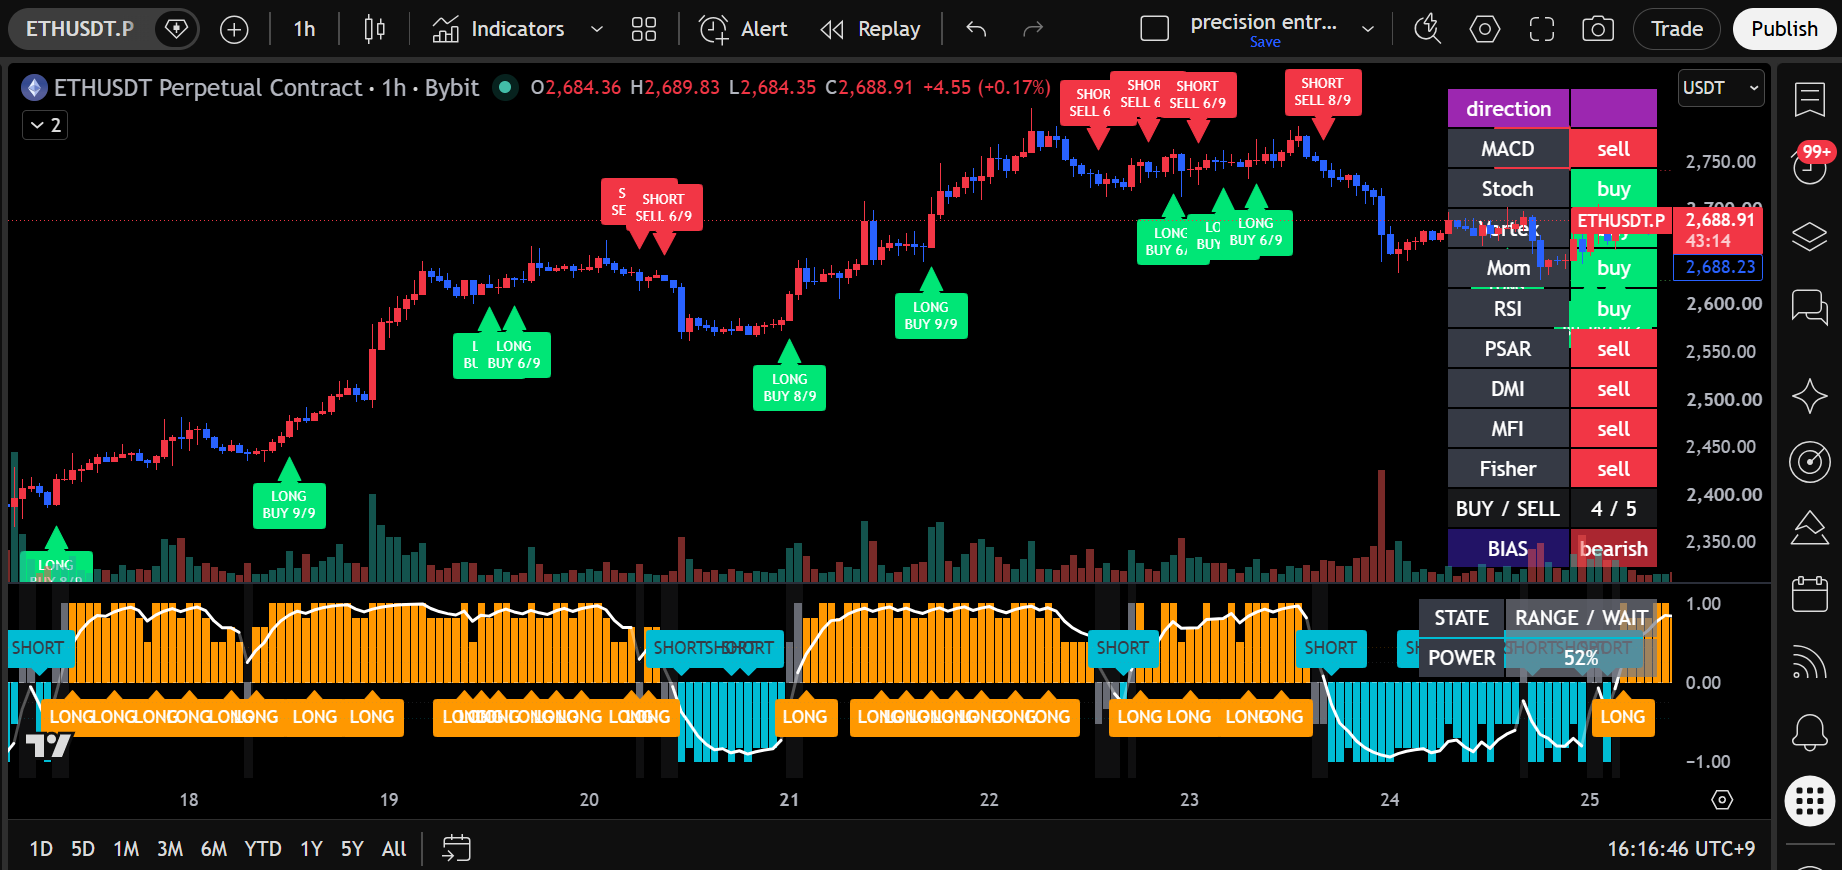
05 / Entry candidates
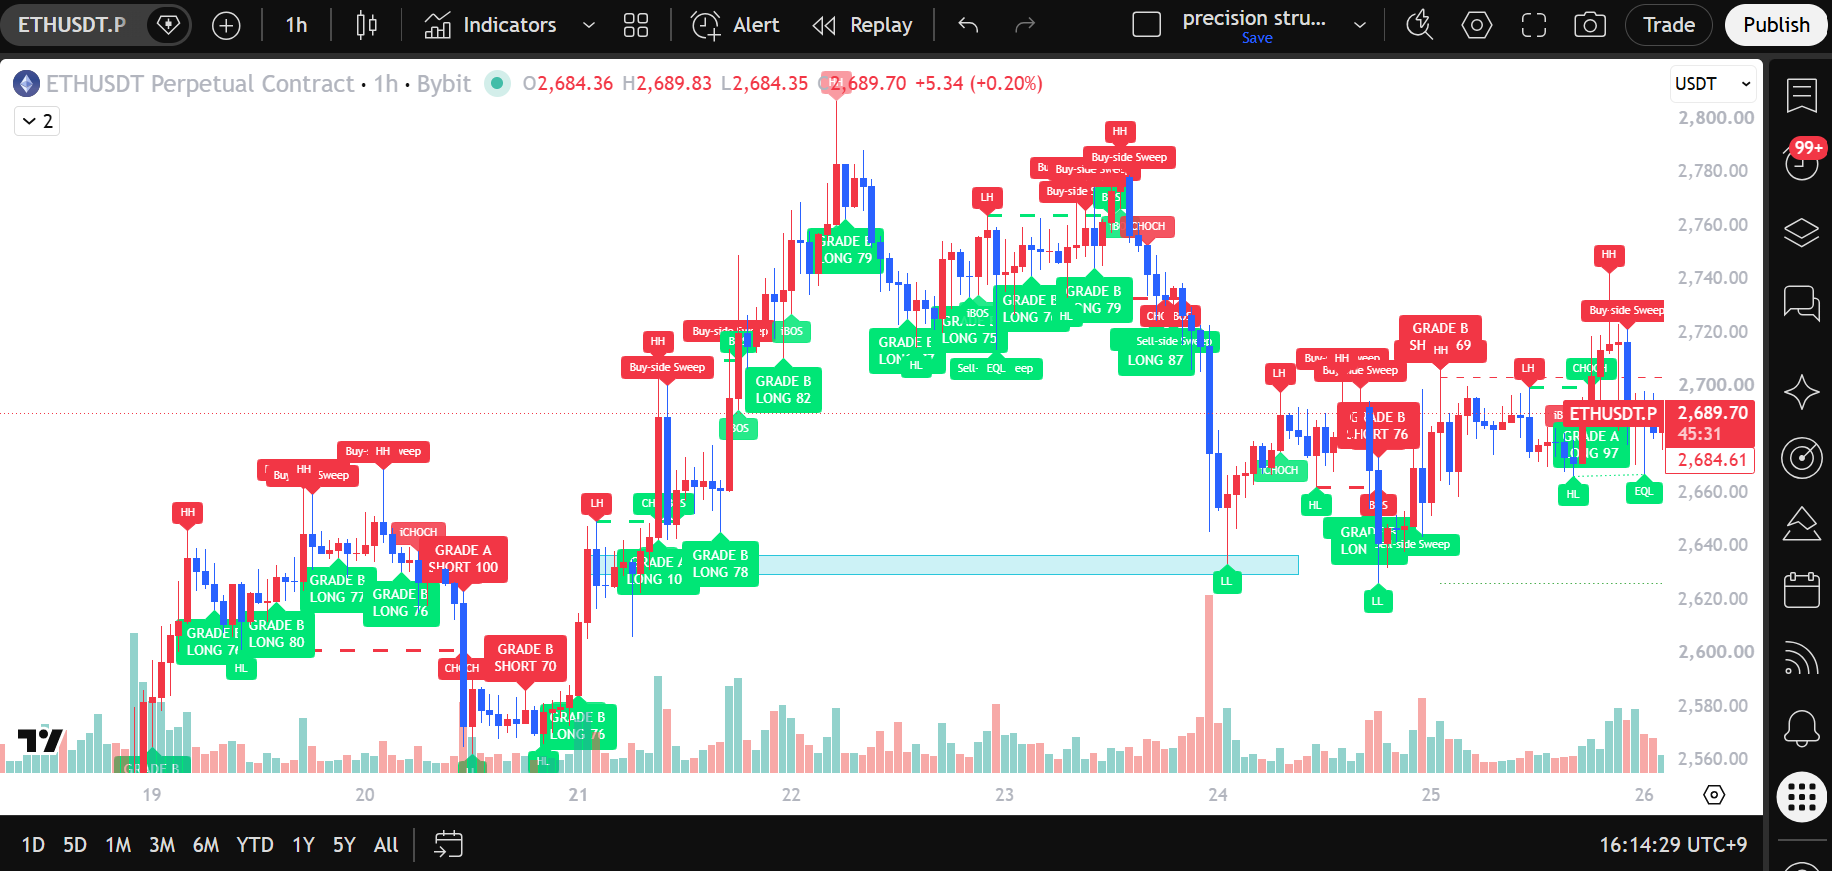
06 / Structure filter
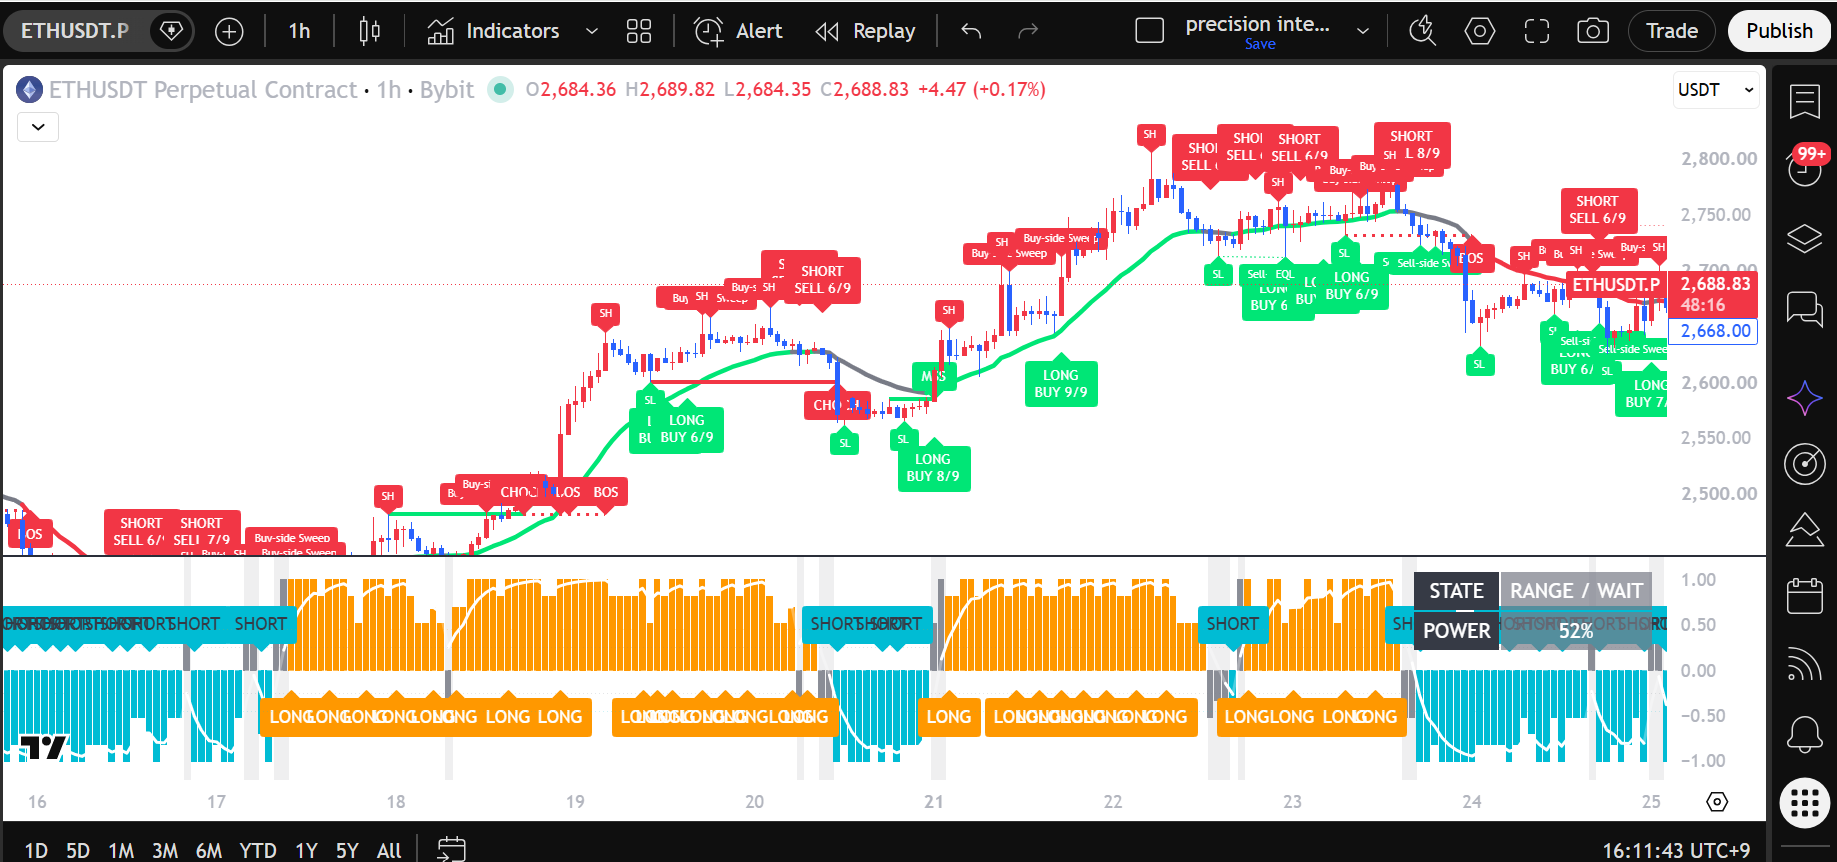
07 / Combined workspace
Descriptions summarize the supplied product documents. A displayed signal or score is not a measured success probability. Screenshots can show different script versions or settings. No verified performance figures were supplied.
05 / Further reading
Use the original material to understand the author’s terminology, and compare it with general technical-analysis and market-risk education.
These are independently interpreted, owner-supplied screenshots. Cropped images do not prove a complete setup or a tested strategy.
This site is not affiliated with or endorsed by The Inner Circle Trader, Schwab or the CFTC. Nothing here is personalized investment advice.