Slow & Steady chart study guide
Getting started and lessons 1–5
New here? Start here
ICT has plenty of terms, but you do not need to memorize them all at once. Learn what to look at first and what to check next. In this course you will separate observation from interpretation and practice reasoning without using information that only became available later.
The goal is to explain why you read a chart a certain way, rather than simply naming patterns correctly.
A common remark from people learning ICT is: “It all made sense in the video, but when I opened a chart I couldn’t see anything.” Knowing the terms and finding the patterns are different skills. Start with the order in which you read the chart.
1 Compare highs and lows
Begin with swings of comparable scale. Learn to identify a higher high (HH), higher low (HL), lower high (LH), and lower low (LL).
Learning goal: Choose swings consistently and classify them as HH, HL, LH, or LL.
2 Mark levels others might be watching
Look for buy-side liquidity (BSL) above earlier highs and sell-side liquidity (SSL) below earlier lows. Distinguish a sweep, where the same candle closes back inside, from a run or breakout, where it closes outside.
Learning goal: Mark BSL and SSL and classify the event by where the same candle closes.
3 Check whether the structure holds or changes
Learn break of structure (BOS), change of character (CHOCH), and market structure shift (MSS). Check the reference swing and candle close before choosing a label.
Learning goal: Use protected highs and lows to distinguish BOS, CHOCH, and MSS.
4 Examine the areas left by a fast move
Compare a fair value gap (FVG), a three-candle imbalance, with an order block (OB). Learn how consequent encroachment (CE), the gap midpoint, differs from the 50% level of a broader range.
Learning goal: Locate the boundaries of an FVG and an OB and explain the two midpoints.
5 Hide the right side and keep a record
In lesson 5, reveal candles you have not seen and record your reasoning. Put your first notes alongside any changes you make as new information appears.
Learning goal: Record only what was knowable at the time and why your interpretation changed.
How to use this course
Read the lesson, mark the chart yourself, and answer the questions before reading the explanations. The calculation exercises use hypothetical numbers. If you get stuck writing your notes, open the lesson 5 template.
SSIDI Learn is a learning aid for comparing your own chart marks. It does not provide trade signals. A marker drawn on an earlier candle was not necessarily available when that candle formed. Lesson 5 explains confirmation timing.
Lesson 1 Reading structure through highs and lows
Prices can pull back several times in an advance. Instead of focusing on the direction of a few candles, note where a pullback ends and where the next high forms. Define the comparison range before labeling swings.
How to identify a swing
For this exercise, a swing high must have a strictly higher high than the two candles on each side. A swing low must have a strictly lower low than the two candles on each side. Ties do not qualify.
The middle candle alone tells you nothing about the next two. A swing is confirmed only after the second candle to its right closes. This exercise rule is separate from SSIDI Learn settings. The chart annotations illustrate the larger move and need not match every result of the two-candle rule.
Compare highs with highs and lows with lows. A higher high is an HH and a lower high is an LH. A higher low is an HL and a lower low is an LL. A sequence of HHs and HLs suggests bullish structure; LHs and LLs suggest bearish structure.
Internal and external structure
External structure is the main highs and lows of the larger move under review. Internal structure is the smaller movement between them. Both can appear on the same one-hour chart; write down the endpoints of your comparison range first.
Protected lows and highs
In this course, a protected low is the swing low that starts the advance which closes above a reference high. A protected high is the swing high that starts the decline which closes below a reference low.
Consider 100 → 90 → 110 → 96 → 118 → 103. If the advance from 96 closes through 110 and reaches 118, 96 can serve as the protected low for that advance. Although 103 is a more recent HL, it does not assume that role unless it produces a break of 118.
A common mistake is to assume an uptrend is over when a small low breaks and take the opposite side, only to see price resume making higher highs. The break was part of a smaller pullback within the larger advance. Check the scale of the swing first.
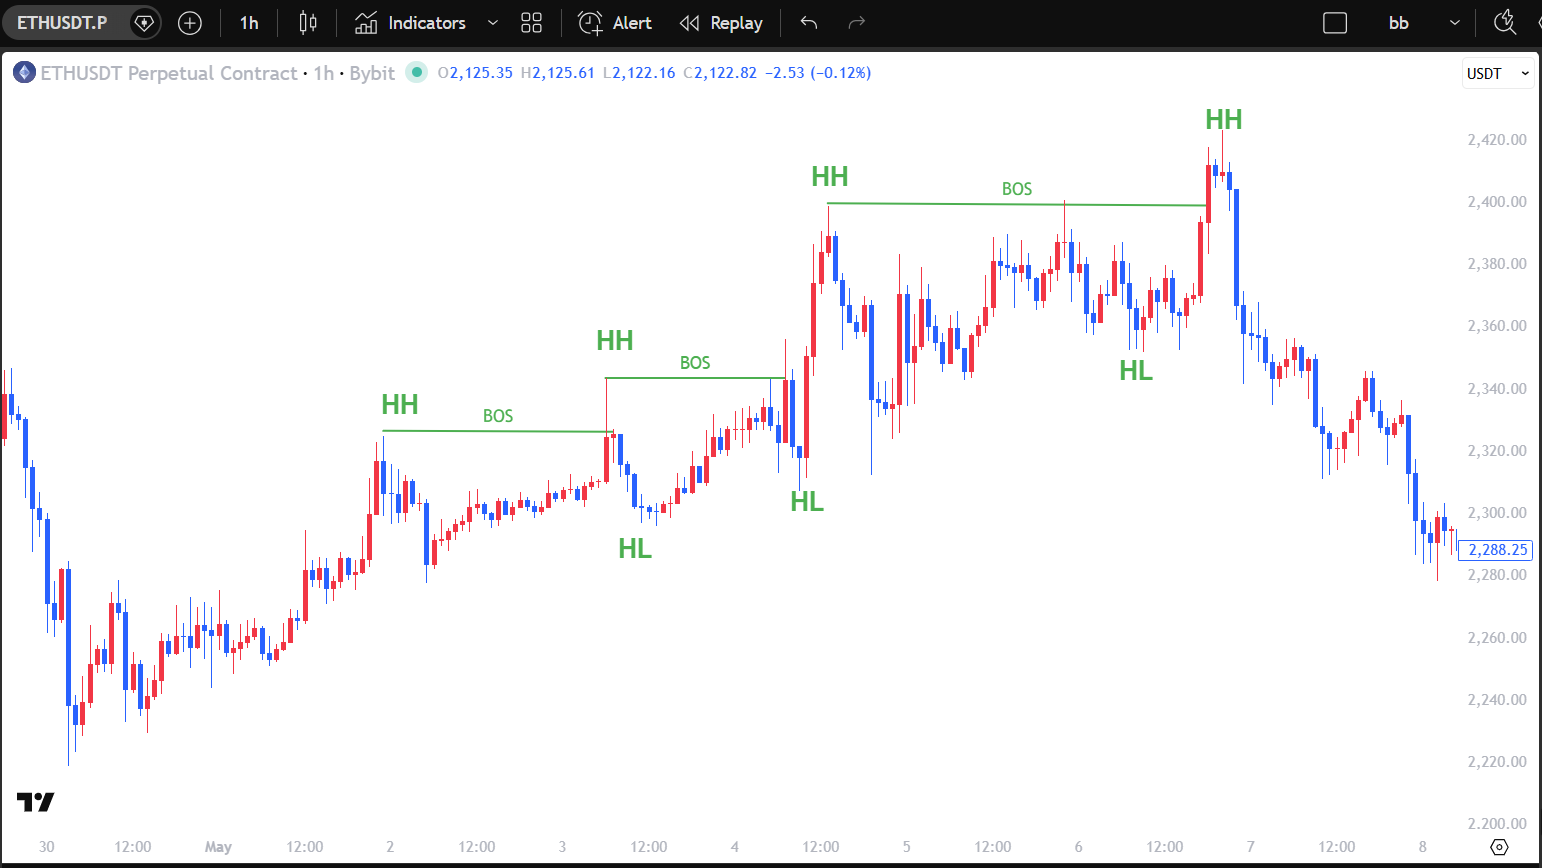
What to look for
After the low near 2,220, highs and lows rise in succession. The major HHs and HLs in the middle advance can be treated as external structure; smaller fluctuations between them are internal. Including the far-left high changes the meaning of the first HH, so set the starting point first.
Common mistake
A break of 103 is not the same event as a break of 96. A smaller break may be a pullback within the larger structure. Do not infer the next direction from several bullish candles or a single HH.
Exercises and explanations
1. Chart range. Find two signs of bullish structure in the central advance on chart 1. Does the same reading hold at the far right?
Explanation. Higher highs and higher lows repeat. A decline appears at the right edge, so reassess the most recent reference swing for that part of the chart. The first HH refers to the comparison after the low near 2,220, not the highest point of the entire visible chart.
2. Classify the numbers. The swings are high 100 → low 90 → high 110 → low 96 → high 118 → low 103. Classify the later highs and lows.
Explanation. 110 and 118 are HHs; 96 and 103 are HLs. The sequence is bullish by this rule. 100 and 90 are starting references; without earlier data, do not label them HH or LL.
3. Two different lows. Price closes at 102 after a recent major low of 103. What does that tell you? Is a broad downtrend confirmed?
Explanation. Price closed below the recent HL at 103, so examine a smaller structural change or pullback. Assuming the advance to 118 closed above 110, the protected low is 96. A close at 102 is still above it. Record a separate break of the larger structure if price later closes below 96.
Review checklist
Write down the starting range and the endpoints of the larger swing. Explain whether the latest HL and the protected low are the same before moving on.
Next lesson
See why orders may cluster beyond these highs and lows.
Lesson 2 Liquidity beyond highs and lows
Stops for shorts and buy orders waiting for a breakout can sit above earlier highs. Stops for longs and sell orders waiting for a breakdown can sit below earlier lows. Orders may cluster when people watch the same levels.
ICT calls the potential liquidity above highs BSL and below lows SSL. Mark conspicuous highs and lows before price reaches them.
When levels repeat
Similar highs are equal highs (EQH); similar lows are equal lows (EQL). Set a tolerance in advance based on the instrument’s tick size or volatility. Here we compare the visible shapes rather than apply a numerical threshold.
Sweep or run?
Use one candle. A candle that trades above a marked high and closes back below it is a BSL sweep. A candle that trades below a marked low and closes back above it is an SSL sweep. A close beyond the level is a run or breakout. A close exactly on it is a boundary close, classified as neither.
People often draw a line only after price takes a high and returns, saying, “That was BSL.” Lines drawn after the event always look convincing. Mark the level before price arrives so you can observe what actually happens there.
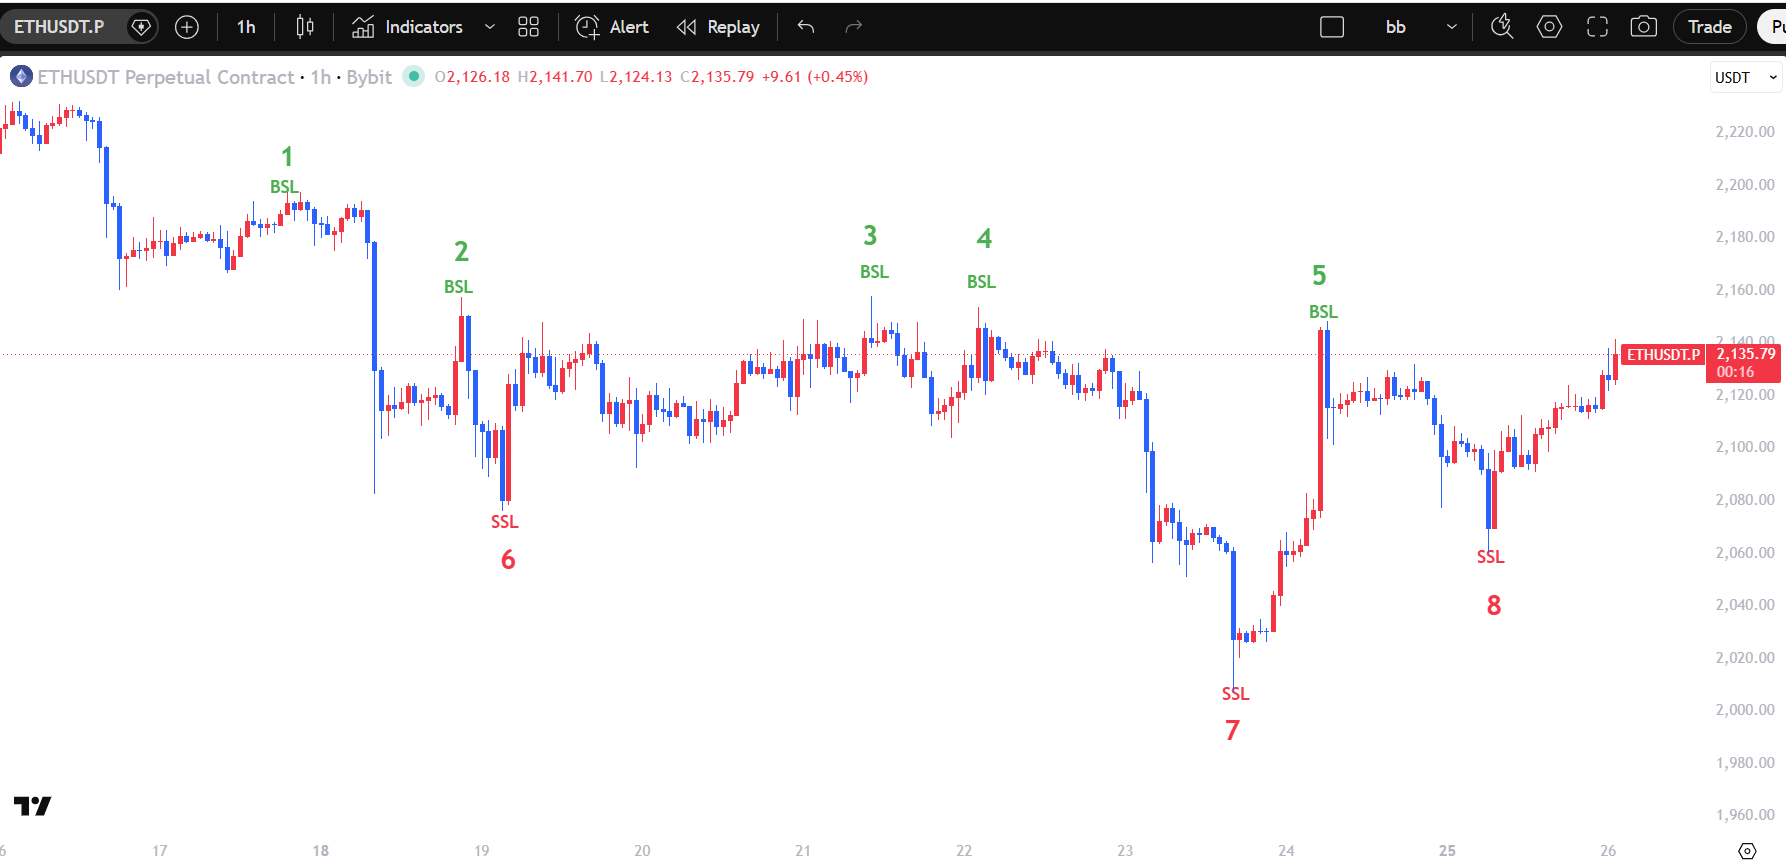
What to look for
Numbers 1–5 mark potential BSL above highs; 6–8 mark potential SSL below lows. Highs 3 and 4 are close enough visually to illustrate EQH. To classify them numerically, compare their difference with your preset tolerance.
Common mistake
A numbered level does not indicate that a sweep has happened. Check both the breach and the close. The chart alone does not show actual stop-order volume, and neither a reversal after a sweep nor continuation after a run is guaranteed.
Exercises and explanations
1. Two levels. What do 3 and 7 mark on chart 2? Is the label alone enough to confirm a sweep?
Explanation. 3 marks BSL above a high; 7 marks SSL below a low. Check where the same candle closes after trading through the level.
2. Close inside. A marked high is 200. The next candle reaches 202 and closes at 199. How do you record it?
Explanation. BSL sweep: it traded above 200 and closed back inside at 199.
3. Close outside. What if the high is 202 and the close is 201? Must price keep rising?
Explanation. It closed beyond 200, so record a run or breakout. The next candle’s direction is unknown. If using multiple candles, specify the number in advance.
Extra: Similar highs. What do you need before classifying 3 and 4 as EQH?
Explanation. Set the permissible price difference. Keep visual resemblance separate from classification by a numerical rule.
Review checklist
□ I marked the reference level before price reached it.
□ I noted the breach and the close separately.
□ I set a tolerance before grouping similar highs or lows.
Next lesson
See how a move through liquidity affects structure.
Lesson 3 When structure continues or changes
A brief move above a high does not tell the whole story. Check the scale of the swing, whether the move aligns with or opposes the existing structure, and which candle closed.
Why the labels differ
CHOCH is common in the SMC (Smart Money Concepts) community; ICT lessons often use MSS. Definitions vary. Compare the conditions that produce a label before comparing the names, including when evaluating indicators.
The rules for this course
BOS is a close through a reference swing in the existing direction: above the reference high in bullish structure or below the reference low in bearish structure.
CHOCH is the first opposing close through a protected swing: below the protected low in bullish structure or above the protected high in bearish structure. We treat it as MSS when the break comes with displacement. Use the protected swing from lesson 1 rather than a small recent HL or LH. Both labels can apply to the same event.
Displacement means a fast directional move with a relatively large candle body. Here we compare nearby candles visually. Automation requires a separately defined lookback and body-size threshold.
The same scene can be called CHOCH in one video, MSS in another, and something else by an indicator. When the names differ, compare which swing and close each method uses.
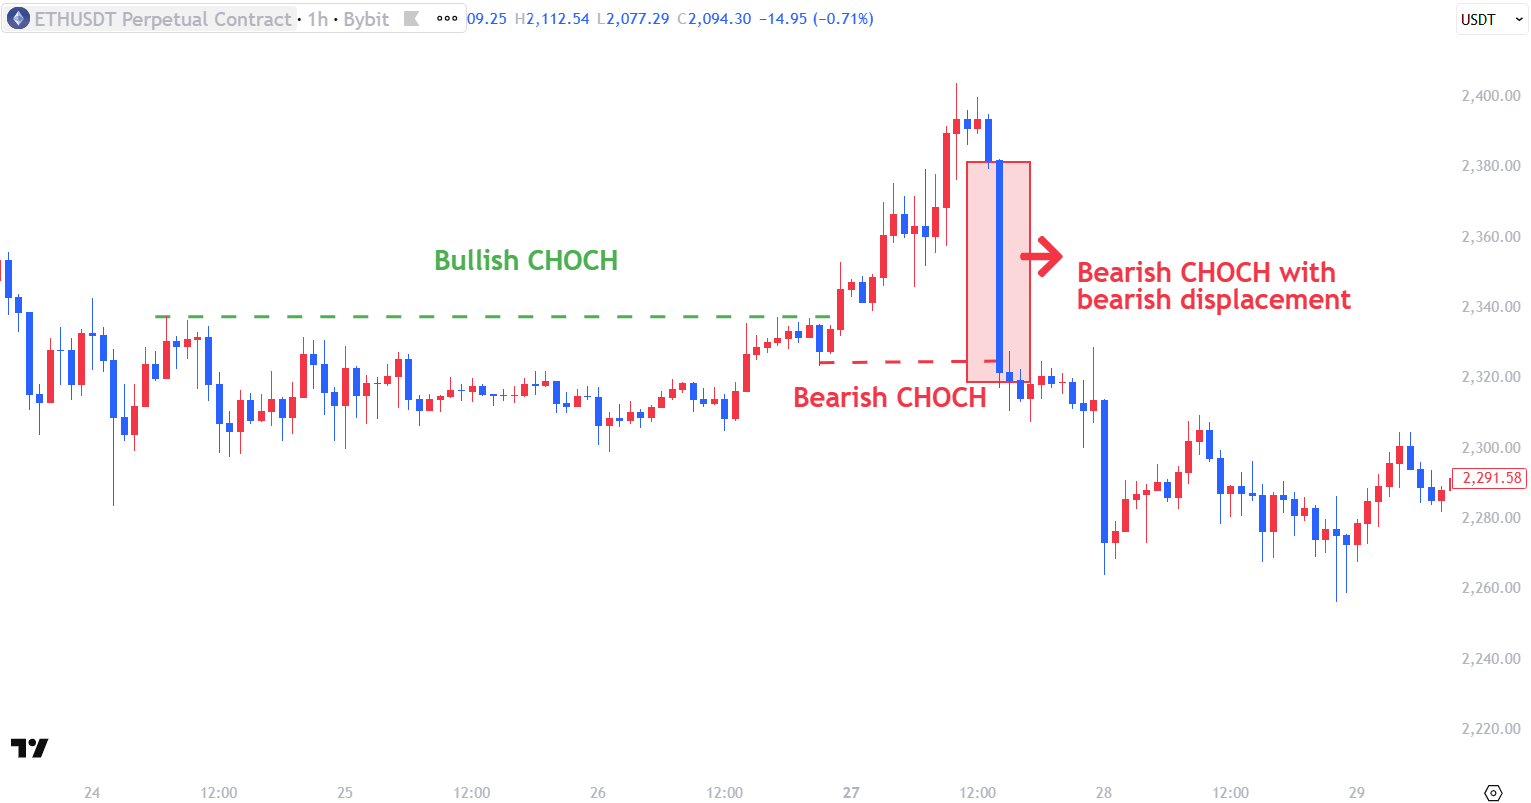
What to look for
The left side moves above a green dashed line; the right side drops sharply below a red dashed line. The falling candle is blue. Do not let red annotations make you read it as bullish.
The chart says “Bearish CHOCH with bearish displacement.” Under this course’s definitions, a structural break against the previous direction with displacement is closer to MSS. Identify the reference swing and candle close.
Common mistake
Do not memorize CHOCH and MSS as mutually exclusive. Educators and SSIDI Learn use their own rules. Separate the candle a historical marker sits on from the time the marker became available.
Exercises and explanations
1. Evidence of a sharp decline. What can you see at the right of chart 3, and what can you not tell from it?
Explanation. A large blue bearish body and a downside break of the marked level are visible. The image does not reveal exact automation thresholds, participants’ order intent, or subsequent returns.
2. Wick and close. The protected low is 96. Candle A has a low of 94 and closes at 97. Candle B has a low of 93 and closes at 95. Which first confirms a break on a closing basis?
Explanation. B. A traded below 96 but closed above it. B closed below 96, so under our rules this is CHOCH. If B is a downward displacement candle with a larger body than nearby candles, it can also be read as MSS.
3. Different labels. One indicator marks CHOCH and another marks MSS. What should you compare first?
Explanation. Compare the selected swing, close requirement, displacement rule, and confirmation timing.
4. Revisit the annotation. Which course definition best fits “Bearish CHOCH with bearish displacement”?
Explanation. MSS, because it includes both a break against the prior structure and strong movement.
Review checklist
Identify the broken swing in one sentence. Then use the close and body to explain the structural change and the strong move separately.
Next lesson
A strong move often leaves an FVG across three candles. Next, learn to locate that gap.
Lesson 4 Areas left by a fast move
A sharp move can leave a zone where the wicks of the outer candles do not overlap. Marking the zone lets you say exactly what area you are watching on a revisit. Check the three candles before drawing a box.
FVG and its midpoint
A bullish FVG exists when candle 3’s low is above candle 1’s high. A bearish FVG exists when candle 3’s high is below candle 1’s low. Mark the boundaries once candle 3 closes.
CE is the midpoint of the FVG: add the two boundaries and divide by two. For a bullish FVG from 100 to 104, CE is 102.
Premium and discount
Choose the high and low of a range and mark the midpoint at 50%. Above it is premium; below it is discount. The midpoint of 90–118 is 104.
The calculation is the same as CE but applies to a different range. CE is the midpoint of one FVG; premium and discount refer to the chosen broader range. Change the range and the 50% level changes.
How an order block differs
In this course, link the bearish candle immediately before a strong rise, or the bullish candle immediately before a strong fall, to a structural change. Decide whether to use its body or include its wicks. Boxing every candle of the opposite color obscures the rule.
If you treat FVGs and OBs as identical support boxes, you can cover the chart and claim any reaction came from a box. Remember their different starting points: a non-overlapping zone across three candles versus the candle just before a strong move.
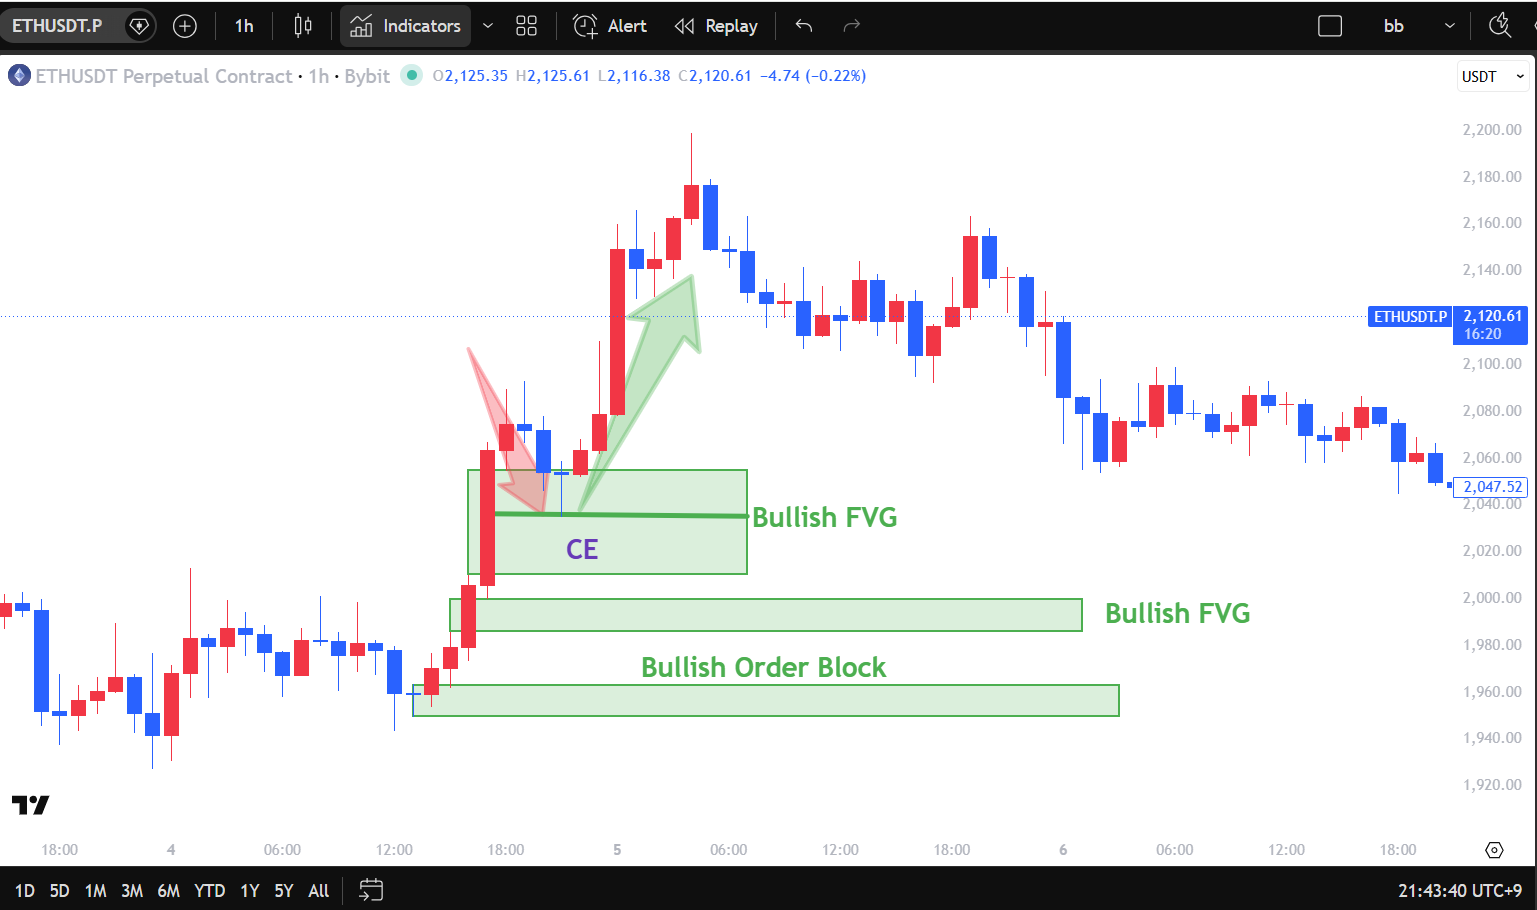
What to look for
The bottom box is a bullish OB; the two above are bullish FVGs. The OB uses its reference candle, and an FVG uses the gap across three candles. CE inside the upper FVG refers only to that gap. Record the revisit, immediate reaction, and later movement separately.
Common mistake
Premium and discount are not instructions to sell or buy. Touching CE or reacting once does not establish profitability. An OB does not prove institutional order volume. For the exercise, a close below the bullish FVG’s lower boundary invalidates the support interpretation.
Exercises and explanations
1. Different boxes. Are the bottom OB and the FVG above it the same? What is CE?
Explanation. No. The OB uses a reference candle linked to displacement and a structural change; the FVG is the non-overlapping interval across three candles. CE is that FVG’s midpoint.
2. Calculate an FVG. Candle 1’s high is 100 and candle 3’s low is 104. Find the gap and CE. What if candle 1’s low is 110 and candle 3’s high is 106?
Explanation. Bullish FVG: 100–104, CE = (100+104)/2 = 102. Bearish FVG: 106–110, CE = (106+110)/2 = 108. Use the appropriate highs and lows of candles 1 and 3.
3. Invalidation. A candle revisiting the bullish FVG 100–104 trades down to 99 but closes at 101. The next candle closes at 99. When is the support interpretation invalidated on a closing basis?
Explanation. The first candle only wicks below the boundary. The next close at 99 is below 100, so record invalidation then.
Quick check. What are the midpoints of the FVG 100–104 and the broader range 90–118?
Explanation. The FVG CE is 102; the broader range midpoint is 104. Always specify the range used.
Review checklist
□ I used the first and third candle boundaries.
□ I stated whether the OB uses bodies or wicks.
□ I calculated CE and the wider range midpoint separately.
□ I recorded the revisiting candle’s wick and close separately.
Next lesson
Hide the right side of a new chart and keep a chronological record.
Lesson 5 Practice on a chart you have not seen
It is easy to explain a chart when the outcome is visible. Before revealing the next candle, write down what you know and what you do not. Keep your first record and add why you changed your interpretation.
Swing location and confirmation time
Under the two-candle rule, a potential 11:00 high cannot be confirmed until the 12:00 and 13:00 candles close. Timestamps indicate candle opening times. When the 13:00 candle closes at 14:00, a marker can be placed on the 11:00 candle. Record it as “11:00 high confirmed at 14:00.”
Replay makes a common habit visible: once you know the result, reasons come too easily. Check whether you could actually have seen that evidence at the time. Often it only looks obvious in hindsight.
What to look for
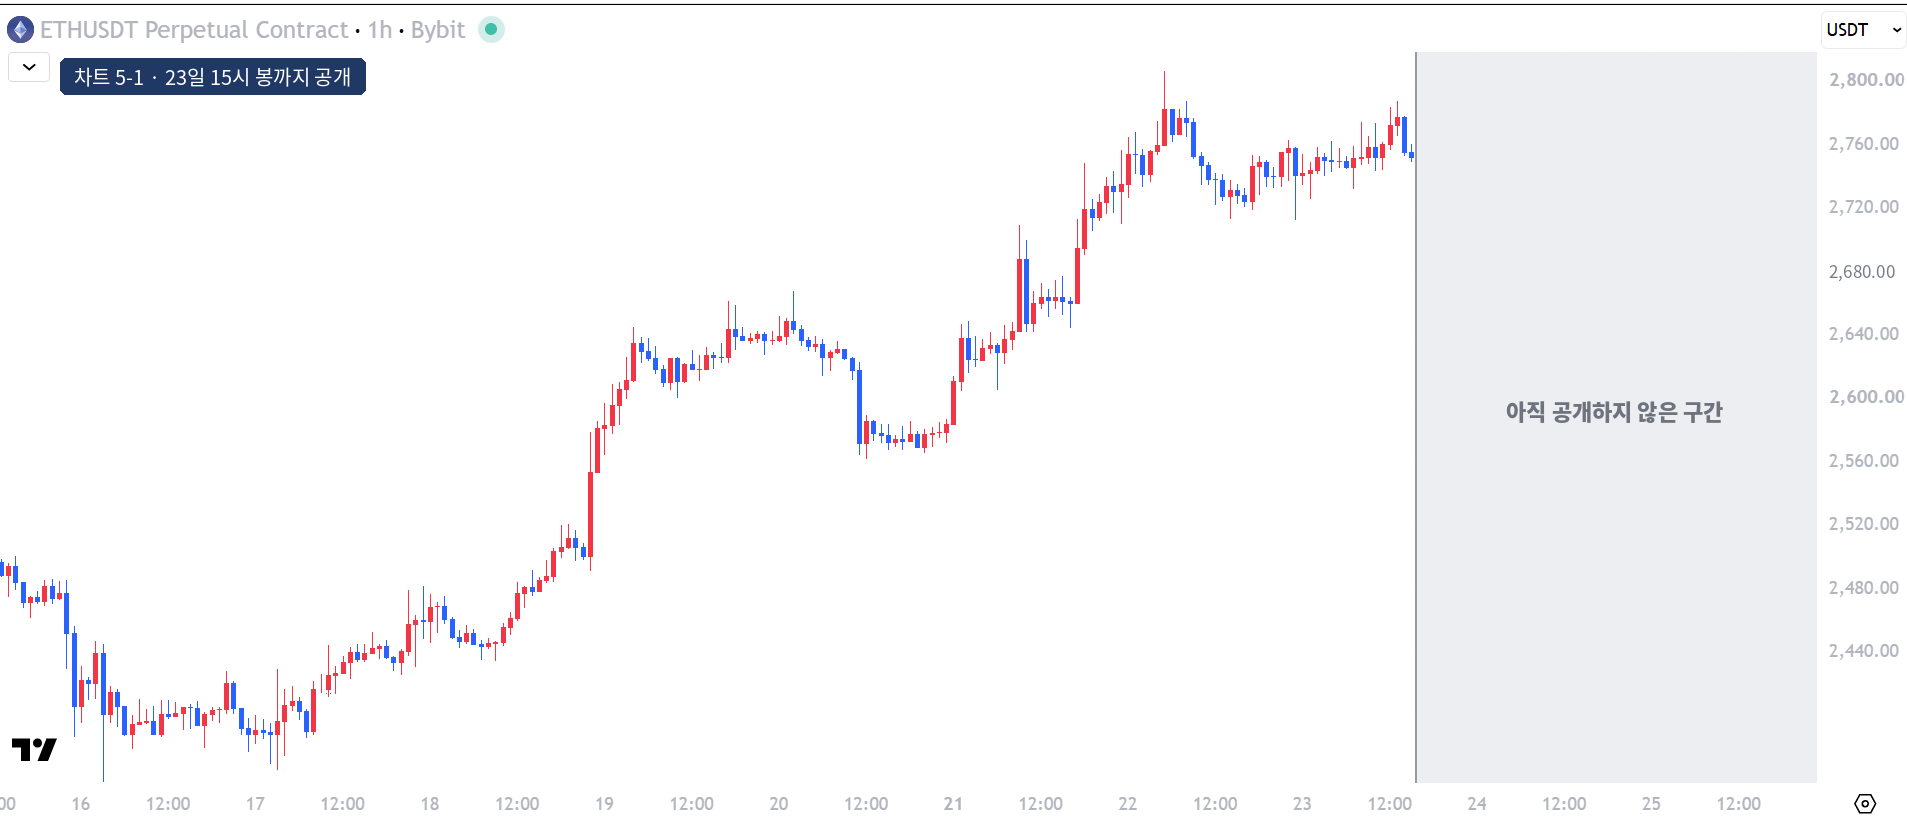
Start with chart 5-1. Pick highs and lows only from the visible section and mark your range, BSL, and SSL. Reveal the next image after each exercise. Record breaches and closes and note evidence of any structural change or FVG.
Common mistake
Do not use a marker that had not appeared at the time. SSIDI Learn confirmation timing can depend on its settings. A single replay is not evidence of a win rate or trading performance.
Exercises and explanations
Observation template
Instrument and exchange ___ Timeframe ___ Last revealed candle ___
Confirmed swings ___ Comparison range ___
Observed facts ___
My interpretation ___ Alternative ___
What would change my reading ___
New facts after the next reveal ___
Revised interpretation and why ___ First confirmation time ___
1. Record chart 5-1. You can see only through the September 23 15:00 candle. Record the structure and protected low, liquidity levels above and below, and what would change your interpretation.
Explanation. Higher highs and lows formed from September 16 to 22. The last HH was about 2,805 early on September 22. The advance from the September 21 16:00 low of 2,645.31 closed above that morning’s high near 2,708. We use 2,645.31, the swing low immediately before that breakout, as the protected low.
Two similar lows near 2,712 formed in the afternoon and evening of September 22. Treat them as EQL and potential SSL. Look for BSL above 2,805. The high near 2,786 around 13:00 on September 23 was an LH, confirmed after the two candles to its right closed through the 15:00 candle.
Record two conditions: a close below 2,712 changes the smaller structure; a close below 2,645.31 breaks the larger bullish structure.
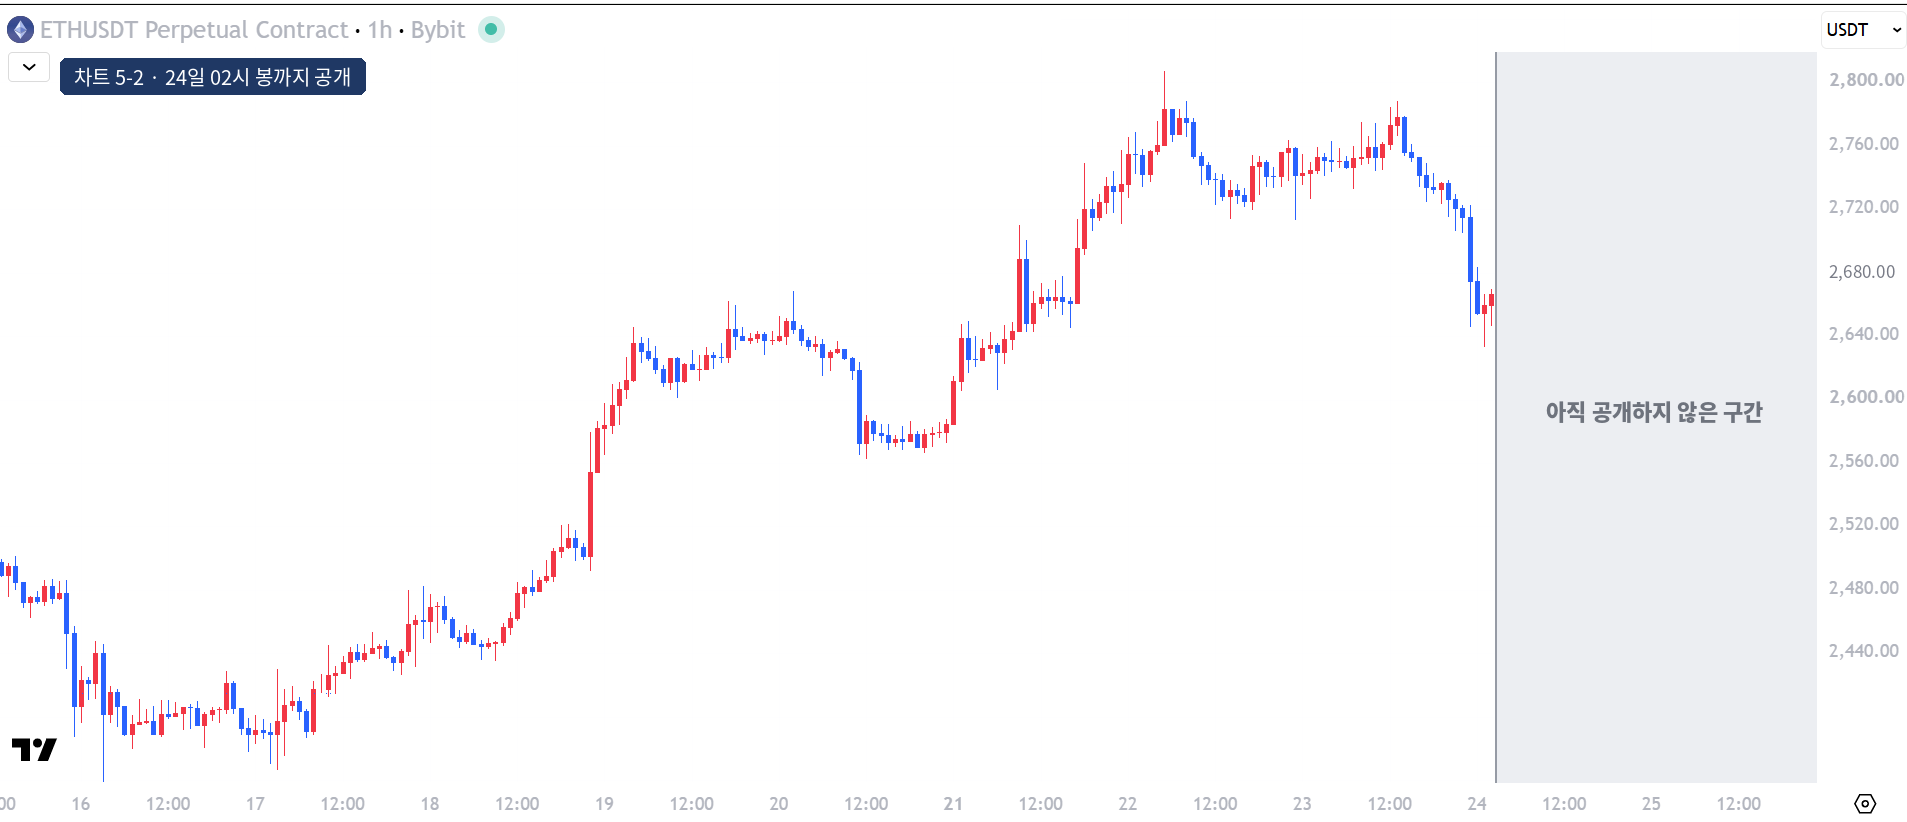
2. Add observations from chart 5-2. Keep your first record. What is new through 02:00 on September 24? Can this decline be called CHOCH?
Explanation. After declining from the afternoon of September 23, the 23:00 candle moved from about 2,713 to 2,673. Its body is much larger than nearby candles, suggesting displacement. It closed below the lows near 2,712, so record a run or breakout, not a sweep. The first condition was met: the smaller structure changed.
The fall left a bearish FVG between the September 23 22:00 low near 2,704 and the September 24 00:00 high near 2,681. Using the displayed boundaries, its CE is approximately 2,692.5.
The September 24 01:00 candle wicked below the protected low to about 2,632, but closed above the protected low. Like candle A in lesson 3, exercise 2, it is not CHOCH by our rule. Until a close breaks the protected low, record only the smaller structural change and sharp decline.
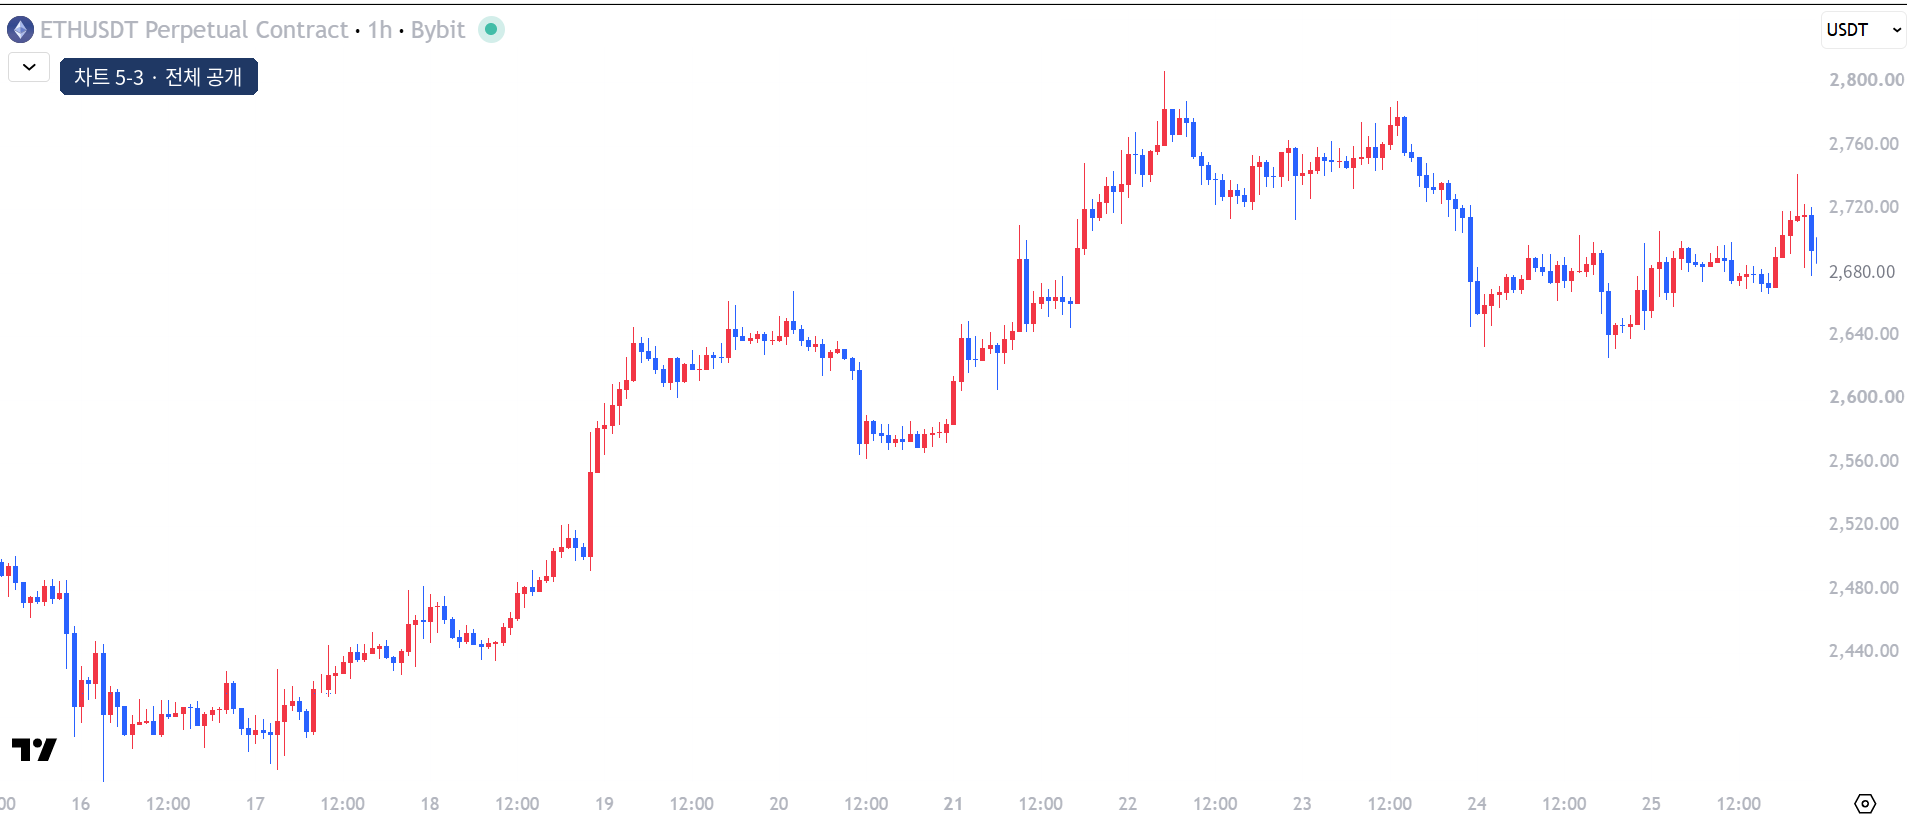
3. Finish with chart 5-3. What happened to the bearish FVG and how would you classify the September 24 evening decline? How should you update your first record after seeing the outcome?
Explanation. During September 24, price revisited the bearish FVG, rising to around 2,695–2,702 before falling again. Record the revisit and the subsequent decline separately. On the evening of September 25, price closed above the upper boundary near 2,704. Using lesson 4’s close rule, the resistance interpretation was invalidated.
The September 24 18:00 candle wicked below the 01:00 low near 2,632 to about 2,625, then closed above the 01:00 low. That is an SSL sweep on the smaller range. The same candle closed at 2,641.32, which is 3.99 below the larger structure’s protected low of 2,645.31 from September 21 at 16:00. That close is CHOCH under this course’s rule.
You may want to rewrite the evening wick as “the bottom” after seeing the outcome. Keep your first record and append the new facts and when you observed them.
4. An unconfirmed high. Hypothetical swings are high 100 → low 90 → high 110 → low 96. Price then reaches 118 and everything after that candle is hidden. Assume the close above 110 is known. What can and cannot be recorded?
Explanation. Record confirmed swings 100, 90, 110, and 96 and the close above 110. 110 is HH, 96 is HL and the protected low. 118 is the highest price so far, but it is not a confirmed swing high until the next two candles have closed and the rule is satisfied. Do not label it HH yet. The next candle’s direction and size and any later trade outcome are unknown.
5. 11:00 and 14:00. The 13:00 hourly candle closes at 14:00 and meets the confirmation rule. The indicator marks the 11:00 high. Did you know about it at 11:00?
Explanation. No. The marker is placed at 11:00, but you could confirm it only at 14:00. Write “11:00 high confirmed at 14:00.”
6. Revising notes. You recorded bullish structure and price subsequently closed below the protected low. Should you delete the original and write that you expected a decline all along?
Explanation. Keep the first entry. Add the time of the closing break and why it changed your reading. Updating with new information is different from rewriting history.
Review checklist
Mark each item “done” or “needs work” and match it to a line from your notes.
1. I applied one swing rule consistently.
2. I set liquidity levels before price arrived.
3. I recorded swing location and confirmation time separately.
4. I set the condition for changing my reading before seeing the next candle.
5. I kept my initial notes and the reason for the change.
Next steps
Use the same template on a different chart window. To compare your reading with SSIDI Learn, put the chosen swings and confirmation times side by side.
About Slow & Steady
Slow & Steady explains market structure and ICT using real charts at slowsteadytrading.com. The goal is to help readers find the evidence and explain it in their own words. The site offers chart study material and introduces SSIDI Learn, an educational indicator.
Updates: https://t.me/+FO2JAhY67vkwZmY9
Editorial principles
We separate chart observations from our interpretation. We do not present hindsight labels as contemporaneous decisions or actual profits. We include credentials or results only where verifiable. When we find an error, we correct it and record the change.
Educational purpose
This material is for general chart education. It does not provide personalized buy or sell recommendations or guarantee returns. Digital assets and leveraged trading carry a risk of loss. This is not an official Inner Circle Trader course or affiliated site.